
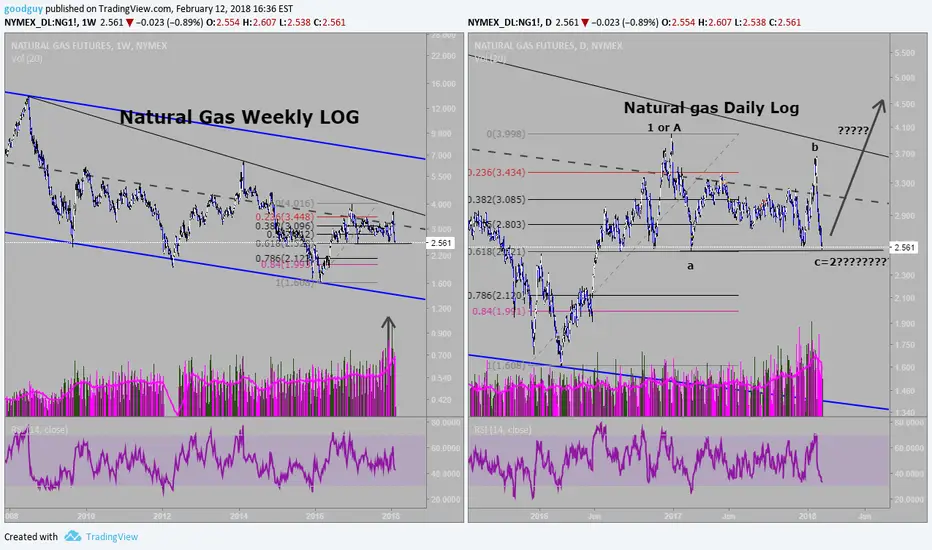
Natural Gas from the weekly chart clearly is in a longer term downtrend. From the daily chart we are now for the 2nd time at a .62 retraction of the recent rise. IFFF the sideways action since is what the EWT folks call a "flat" we may well be ready for a sizable up move. Stay tuned. Feedback on this would be greatly appreciated as the picture is far from clear. Would like to know what others think.
Anmerkung
Good start this week. In EWT one of the rules is that wave 1 and 4 cannot overlap. However occasionally (for me at times of transition) wave 1 or wave 5 can have 5 overlapping waves where wave 4 overlaps wave 1. These are referred to as "leading diagonal" or "ending diagonal". In the 1 hour chart I think we may have a leading diagonal. If so there will be a strong up move next. Process your way. No pattern is always correct. Anmerkung
Correction. The chart on the left is a Weekly chart.
Haftungsausschluss
Die Informationen und Veröffentlichungen sind nicht als Finanz-, Anlage-, Handels- oder andere Arten von Ratschlägen oder Empfehlungen gedacht, die von TradingView bereitgestellt oder gebilligt werden, und stellen diese nicht dar. Lesen Sie mehr in den Nutzungsbedingungen.
Haftungsausschluss
Die Informationen und Veröffentlichungen sind nicht als Finanz-, Anlage-, Handels- oder andere Arten von Ratschlägen oder Empfehlungen gedacht, die von TradingView bereitgestellt oder gebilligt werden, und stellen diese nicht dar. Lesen Sie mehr in den Nutzungsbedingungen.