
Japan 225 Holds Strong Near the Highs — Breakout Continuation or Short-Term Pullback?
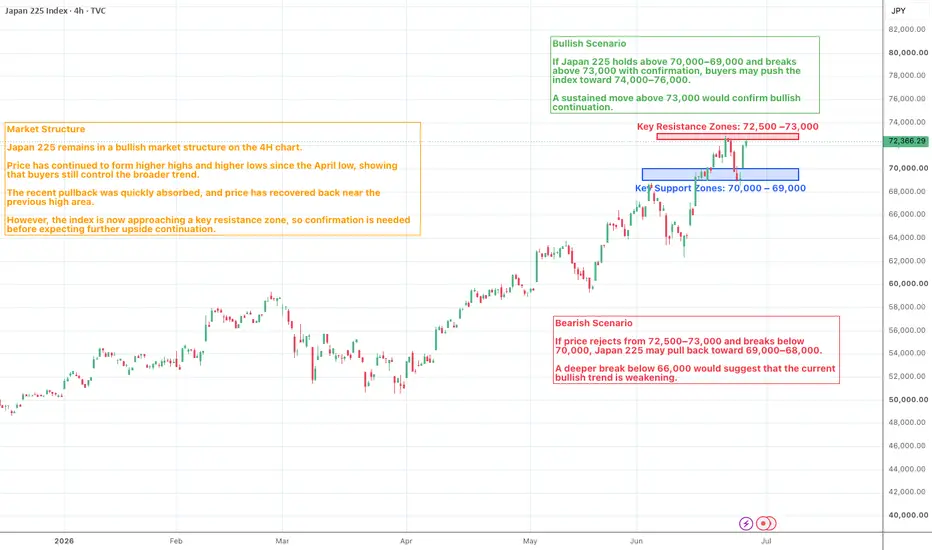
Japan 225 remains in a strong bullish structure on the 4H chart. Since the April low, the index has continued to form higher highs and higher lows, showing that buyers are still in control of the broader trend. The recent pullback was quickly absorbed near the 68,000–69,000 area, and the price has now recovered back toward the upper range around 72,000.
From a market structure perspective, the trend remains bullish, but the index is now trading close to a key resistance zone. This means the market still has upside momentum, but chasing directly near the highs may carry higher risk unless the price confirms a clean breakout.
The first key resistance zone is around 72,500–73,000. This is the immediate area where sellers may try to slow the move. If Japan 225 breaks and holds above this zone, bullish momentum could extend toward 74,000 and potentially 76,000.
On the downside, the first key support zone is around 70,000–69,000. This area is important because it recently acted as a reaction zone during the pullback. As long as the price stays above this support, the bullish structure remains healthy. Below that, the stronger support zone sits around 68,000–66,000, which would be the next important area if a deeper correction develops.
For the bullish scenario, Japan 225 needs to hold above 70,000–69,000 and break above 73,000 with confirmation. If buyers can keep price above the previous high area, the next upside targets are 74,000 and 76,000. A clean breakout would confirm that buyers are still willing to defend the trend.
For the bearish scenario, rejection from 72,500–73,000 could trigger a short-term pullback. If price breaks below 70,000, the index may retest 69,000 and possibly 68,000. A deeper break below 66,000 would weaken the current bullish structure and suggest that the market is entering a broader correction phase.
Market sentiment remains bullish, but slightly cautious near resistance. The trend is strong, and buyers continue to defend pullbacks, but the price is now close to the upper reaction zone. The better signal may come from either a confirmed breakout above 73,000 or a controlled pullback into support.
Right now, confirmation matters more than prediction. Above 73,000, bullish continuation becomes stronger. Below 70,000, short-term momentum may start to fade.
What do you think?
Will Japan 225 break above 73,000 and continue toward 74,000–76,000? Or will sellers defend the highs and push the index back toward 70,000?
Please share your view below.
Japan 225 remains in a strong bullish structure on the 4H chart. Since the April low, the index has continued to form higher highs and higher lows, showing that buyers are still in control of the broader trend. The recent pullback was quickly absorbed near the 68,000–69,000 area, and the price has now recovered back toward the upper range around 72,000.
From a market structure perspective, the trend remains bullish, but the index is now trading close to a key resistance zone. This means the market still has upside momentum, but chasing directly near the highs may carry higher risk unless the price confirms a clean breakout.
The first key resistance zone is around 72,500–73,000. This is the immediate area where sellers may try to slow the move. If Japan 225 breaks and holds above this zone, bullish momentum could extend toward 74,000 and potentially 76,000.
On the downside, the first key support zone is around 70,000–69,000. This area is important because it recently acted as a reaction zone during the pullback. As long as the price stays above this support, the bullish structure remains healthy. Below that, the stronger support zone sits around 68,000–66,000, which would be the next important area if a deeper correction develops.
For the bullish scenario, Japan 225 needs to hold above 70,000–69,000 and break above 73,000 with confirmation. If buyers can keep price above the previous high area, the next upside targets are 74,000 and 76,000. A clean breakout would confirm that buyers are still willing to defend the trend.
For the bearish scenario, rejection from 72,500–73,000 could trigger a short-term pullback. If price breaks below 70,000, the index may retest 69,000 and possibly 68,000. A deeper break below 66,000 would weaken the current bullish structure and suggest that the market is entering a broader correction phase.
Market sentiment remains bullish, but slightly cautious near resistance. The trend is strong, and buyers continue to defend pullbacks, but the price is now close to the upper reaction zone. The better signal may come from either a confirmed breakout above 73,000 or a controlled pullback into support.
Right now, confirmation matters more than prediction. Above 73,000, bullish continuation becomes stronger. Below 70,000, short-term momentum may start to fade.
What do you think?
Will Japan 225 break above 73,000 and continue toward 74,000–76,000? Or will sellers defend the highs and push the index back toward 70,000?
Please share your view below.

Haftungsausschluss
Die Informationen und Veröffentlichungen sind nicht als Finanz-, Anlage-, Handels- oder andere Arten von Ratschlägen oder Empfehlungen gedacht, die von TradingView bereitgestellt oder gebilligt werden, und stellen diese nicht dar. Lesen Sie mehr in den Nutzungsbedingungen.
Haftungsausschluss
Die Informationen und Veröffentlichungen sind nicht als Finanz-, Anlage-, Handels- oder andere Arten von Ratschlägen oder Empfehlungen gedacht, die von TradingView bereitgestellt oder gebilligt werden, und stellen diese nicht dar. Lesen Sie mehr in den Nutzungsbedingungen.