
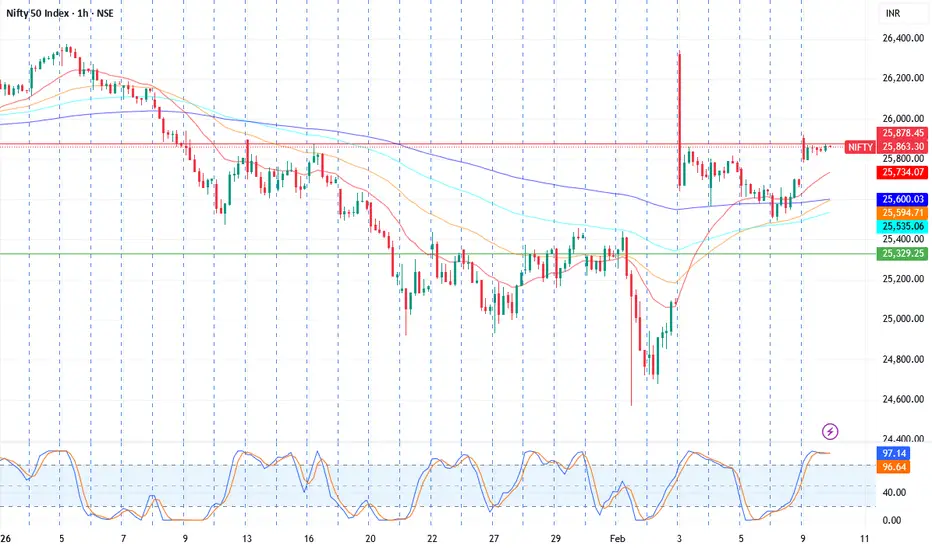
Technical Analysis Report: NIFTY 50 (15m)
1. EMA Trend Analysis
The Nifty 50 opened with a strong gap-up today (approx. +178 points) at 25,888.70, successfully clearing several short-term hurdles.
Current Trend: Bullish. EMAs are moving into a "stacked" ascending order (20>50>100>200).
Key Levels: The price is currently trading above the 200 EMA (approx. 25,650), which acted as a major resistance zone last week but has now flipped to dynamic support.
Crossover Watch: A "Golden Cross" on the 15m chart (20 EMA crossing above the 50 EMA) occurred during the initial morning surge, confirming short-term momentum.
2. StochRSI Analysis
Position: Currently in the Overbought region (≥80).
Signal: The lines are beginning to flatten near the 90–95 level. While the momentum remains strong, the index is "stretched" in the immediate term.
Momentum: Strong upward momentum, but watch for a %K line crossover below the %D line as a signal for a minor intraday cooling period or consolidation.
3. Divergence Detection
Detection: None. Both the price action and StochRSI have made higher highs during the morning session. There is currently no disagreement indicating an immediate reversal.
4. Entry/Exit/Range Logic
Consolidation Range: The index spent most of the midday session consolidating between 25,830 and 25,860.
Support-Resistance Band: * Resistance: 25,922 (Day High) and 26,020 (Psychological Target).
Support: 25,830 (Immediate) and 25,747 (Pivot).
Actionable Insight: Awaiting Confirmation. For fresh Long entries, a decisive close above 25,922 is needed. Current long positions should maintain a trailing stop-loss near the 25,830 mark to protect gains from the gap-up.
1. EMA Trend Analysis
The Nifty 50 opened with a strong gap-up today (approx. +178 points) at 25,888.70, successfully clearing several short-term hurdles.
Current Trend: Bullish. EMAs are moving into a "stacked" ascending order (20>50>100>200).
Key Levels: The price is currently trading above the 200 EMA (approx. 25,650), which acted as a major resistance zone last week but has now flipped to dynamic support.
Crossover Watch: A "Golden Cross" on the 15m chart (20 EMA crossing above the 50 EMA) occurred during the initial morning surge, confirming short-term momentum.
2. StochRSI Analysis
Position: Currently in the Overbought region (≥80).
Signal: The lines are beginning to flatten near the 90–95 level. While the momentum remains strong, the index is "stretched" in the immediate term.
Momentum: Strong upward momentum, but watch for a %K line crossover below the %D line as a signal for a minor intraday cooling period or consolidation.
3. Divergence Detection
Detection: None. Both the price action and StochRSI have made higher highs during the morning session. There is currently no disagreement indicating an immediate reversal.
4. Entry/Exit/Range Logic
Consolidation Range: The index spent most of the midday session consolidating between 25,830 and 25,860.
Support-Resistance Band: * Resistance: 25,922 (Day High) and 26,020 (Psychological Target).
Support: 25,830 (Immediate) and 25,747 (Pivot).
Actionable Insight: Awaiting Confirmation. For fresh Long entries, a decisive close above 25,922 is needed. Current long positions should maintain a trailing stop-loss near the 25,830 mark to protect gains from the gap-up.

Haftungsausschluss
Die Informationen und Veröffentlichungen sind nicht als Finanz-, Anlage-, Handels- oder andere Arten von Ratschlägen oder Empfehlungen gedacht, die von TradingView bereitgestellt oder gebilligt werden, und stellen diese nicht dar. Lesen Sie mehr in den Nutzungsbedingungen.
Haftungsausschluss
Die Informationen und Veröffentlichungen sind nicht als Finanz-, Anlage-, Handels- oder andere Arten von Ratschlägen oder Empfehlungen gedacht, die von TradingView bereitgestellt oder gebilligt werden, und stellen diese nicht dar. Lesen Sie mehr in den Nutzungsbedingungen.