
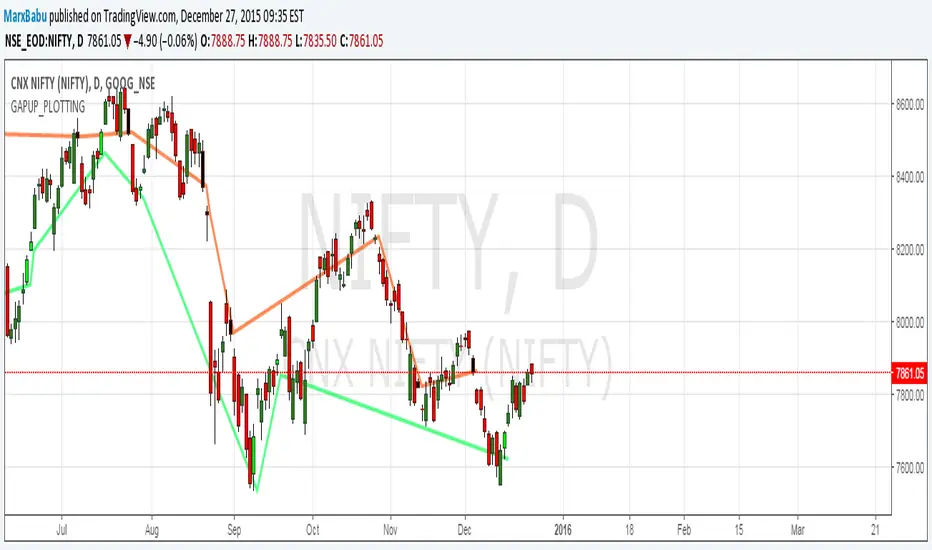
Identify the GAP up and GAP DOWN opening and plot the line.
Strategy when GAPUP identified Buy and target for few 100pips.
1.Color automated Lime candle shows one ahead candle of gapup
2.Black candle shows gapdown.
3.Line drawn for GapUp,GapDown
Strategy when GAPUP identified Buy and target for few 100pips.
1.Color automated Lime candle shows one ahead candle of gapup
2.Black candle shows gapdown.
3.Line drawn for GapUp,GapDown
Anmerkung
The code is available here//version=2
//Author MarxBabu
study(title="GAPUP_PLOTTING", overlay = true)
isUp() => close > open
isDown() => close <= open
//GAP UP DECISION
isGapUp()=> low>low[1] and low>open[1] and low >high[1] and low >close[1] and isUp()
isGapDown()=>high<low[1] and high<open[1] and high< close[1] and high<high[1] and isDown()
x = if isGapUp()
currentLowValue =low[1]
y = if isGapDown()
currentLowValue =close[1]
plot(x, style=line, linewidth=3, color=lime)
plot(y, style=line, linewidth=3, color=red)
barcolor(isGapUp()? #00FF00 :na,-1)
barcolor(isGapDown() ? #030303 :na,-1)

🌳Indicator:bit.ly/2DJVXDn 💚
🦄telegram:t.me/longbuylongsellindicator 🟢
✔️contact:t.me/wealthworldmajic
🎯web:marxcbabu.blogspot.com/
🟠twitter:twitter.com/marxcbabu 💲
youtube.com/@marxcbabu/videos
🦄telegram:t.me/longbuylongsellindicator 🟢
✔️contact:t.me/wealthworldmajic
🎯web:marxcbabu.blogspot.com/
🟠twitter:twitter.com/marxcbabu 💲
youtube.com/@marxcbabu/videos
Haftungsausschluss
Die Informationen und Veröffentlichungen sind nicht als Finanz-, Anlage-, Handels- oder andere Arten von Ratschlägen oder Empfehlungen gedacht, die von TradingView bereitgestellt oder gebilligt werden, und stellen diese nicht dar. Lesen Sie mehr in den Nutzungsbedingungen.
🌳Indicator:bit.ly/2DJVXDn 💚
🦄telegram:t.me/longbuylongsellindicator 🟢
✔️contact:t.me/wealthworldmajic
🎯web:marxcbabu.blogspot.com/
🟠twitter:twitter.com/marxcbabu 💲
youtube.com/@marxcbabu/videos
🦄telegram:t.me/longbuylongsellindicator 🟢
✔️contact:t.me/wealthworldmajic
🎯web:marxcbabu.blogspot.com/
🟠twitter:twitter.com/marxcbabu 💲
youtube.com/@marxcbabu/videos
Haftungsausschluss
Die Informationen und Veröffentlichungen sind nicht als Finanz-, Anlage-, Handels- oder andere Arten von Ratschlägen oder Empfehlungen gedacht, die von TradingView bereitgestellt oder gebilligt werden, und stellen diese nicht dar. Lesen Sie mehr in den Nutzungsbedingungen.