
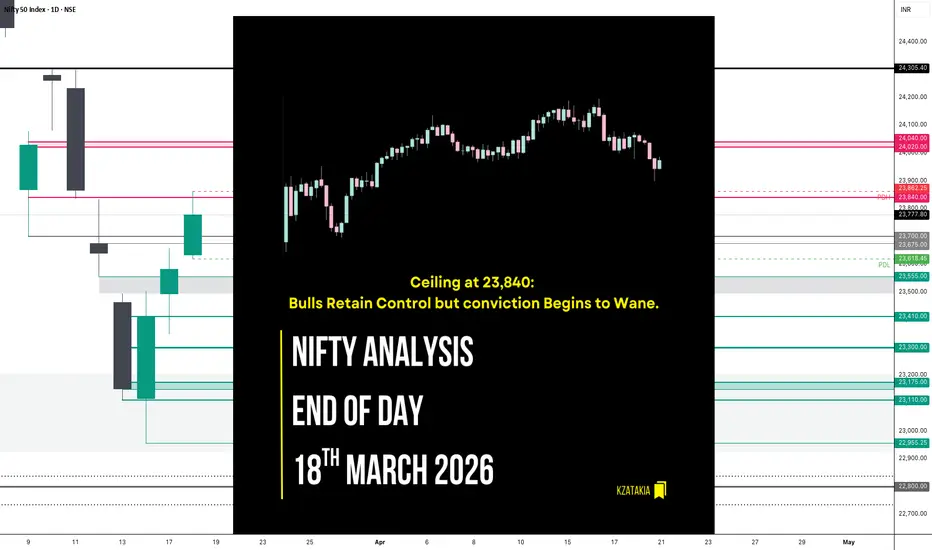
🟢 Nifty Analysis EOD – March 18, 2026 – Wednesday 🔴
Ceiling at 23,840: Bulls Retain Control but conviction Begins to Wane.
🗞 Nifty Summary
Following yesterday’s successful defense, Nifty opened with a confident 77-point Gap Up and quickly added another 105 points in the opening minutes. After a brief period of consolidation, a sharp dip found strong support at the Previous Day High (PDH), triggering a powerful 195-point V-shaped recovery that took the index to 23,835.
However, as noted in previous reports, the 23,840 level proved to be a formidable wall. Multiple attempts to breach this zone failed, signaling a lack of genuine bullish conviction at higher altitudes. Around 2:30 PM, the index broke its intraday trendline, sliding 131 points from the day’s high to close at 23,764.10 (Adjusted close: 23,777.80), gaining +196.65 points (+0.83%).
A key observation today was the erosion of the Nifty Futures premium by 2:20 PM, with futures trading almost at spot prices. This suggests that the immediate upside might be limited. While the day ended in the green, the structure suggests we might see a short-term pullback toward the 23,300 ~ 23,400 zone before the next leg of the rally.
🛡 5 Min Intraday Chart with Levels

📉 Daily Time Frame Chart with Intraday Levels

🕯 Daily Candle Breakdown
Open: 23,632.90
High: 23,862.25
Low: 23,618.45
Close: 23,777.80
Change: +196.65 (+0.83%)
🏗️ Structure Breakdown
Type: Bullish candle with a prominent upper wick.
Range: ≈ 244 points — high intraday volatility.
Body: ≈ 145 points — strong buying strength maintained from the opening gap.
Upper Wick: ≈ 84 points — clear resistance and rejection near the 23,840 barrier.
Lower Wick: ≈ 14 points — minimal selling pressure below the opening tick.
🛡 5 Min Intraday Chart

⚔️ Gladiator Strategy Update
ATR: 386.02
IB Range: 136.2 → Medium
Market Structure: Imbalanced
Trade Highlights:
09:56 Short Trade: Trailing SL Hit (Early rejection attempt).
10:50 Long Trade: Target Hit (R:R 1:1.4) (PDH Support + V-Recovery + IBH Breakout).
13:53 Long Trade: SL Hit (Caught in the 23,840 rejection).
Trade Summary: Today was a day of mixed results for me. I managed to catch the V-shaped recovery move at 10:50 AM after the index defended the PDH, which turned out to be a successful trade. However, trying to push for more near the 23,840 resistance resulted in a stop-loss as the bulls failed to sustain the breakout. It was a good lesson in respecting the overhead “supply wall.”
🧱 Support & Resistance Levels
Resistance Zones: 23,840 | 24,020 ~ 24,040 (Major Hurdle)
Support Zones: 23,618 (Today’s Low) | 23,555 | 23,410 | 23,300 | 23,175 ~ 23,150
🧠 Final Thoughts
“Bulls are still leading, but the air is getting thin.”
The failure to sustain above 23,840 and the vanishing futures premium are warning signs I cannot ignore.
While the trend remains bullish, the base-building process may require a healthy pullback to the 23,300 ~ 23,400 levels to invite fresh buyers.
For tomorrow, I will be watching the 23,840 zone very closely—a decisive close above it opens the doors to 24,000, but a failure there confirms the need for a retracement.
Stay alert and trade cautiously.
✏️ Disclaimer
This is my personal digital diary and represents my own analysis and point of view. It is not financial advice; please consult a professional advisor before making any trading decisions.
Ceiling at 23,840: Bulls Retain Control but conviction Begins to Wane.
🗞 Nifty Summary
Following yesterday’s successful defense, Nifty opened with a confident 77-point Gap Up and quickly added another 105 points in the opening minutes. After a brief period of consolidation, a sharp dip found strong support at the Previous Day High (PDH), triggering a powerful 195-point V-shaped recovery that took the index to 23,835.
However, as noted in previous reports, the 23,840 level proved to be a formidable wall. Multiple attempts to breach this zone failed, signaling a lack of genuine bullish conviction at higher altitudes. Around 2:30 PM, the index broke its intraday trendline, sliding 131 points from the day’s high to close at 23,764.10 (Adjusted close: 23,777.80), gaining +196.65 points (+0.83%).
A key observation today was the erosion of the Nifty Futures premium by 2:20 PM, with futures trading almost at spot prices. This suggests that the immediate upside might be limited. While the day ended in the green, the structure suggests we might see a short-term pullback toward the 23,300 ~ 23,400 zone before the next leg of the rally.
🛡 5 Min Intraday Chart with Levels
📉 Daily Time Frame Chart with Intraday Levels
🕯 Daily Candle Breakdown
Open: 23,632.90
High: 23,862.25
Low: 23,618.45
Close: 23,777.80
Change: +196.65 (+0.83%)
🏗️ Structure Breakdown
Type: Bullish candle with a prominent upper wick.
Range: ≈ 244 points — high intraday volatility.
Body: ≈ 145 points — strong buying strength maintained from the opening gap.
Upper Wick: ≈ 84 points — clear resistance and rejection near the 23,840 barrier.
Lower Wick: ≈ 14 points — minimal selling pressure below the opening tick.
🛡 5 Min Intraday Chart
⚔️ Gladiator Strategy Update
ATR: 386.02
IB Range: 136.2 → Medium
Market Structure: Imbalanced
Trade Highlights:
09:56 Short Trade: Trailing SL Hit (Early rejection attempt).
10:50 Long Trade: Target Hit (R:R 1:1.4) (PDH Support + V-Recovery + IBH Breakout).
13:53 Long Trade: SL Hit (Caught in the 23,840 rejection).
Trade Summary: Today was a day of mixed results for me. I managed to catch the V-shaped recovery move at 10:50 AM after the index defended the PDH, which turned out to be a successful trade. However, trying to push for more near the 23,840 resistance resulted in a stop-loss as the bulls failed to sustain the breakout. It was a good lesson in respecting the overhead “supply wall.”
🧱 Support & Resistance Levels
Resistance Zones: 23,840 | 24,020 ~ 24,040 (Major Hurdle)
Support Zones: 23,618 (Today’s Low) | 23,555 | 23,410 | 23,300 | 23,175 ~ 23,150
🧠 Final Thoughts
“Bulls are still leading, but the air is getting thin.”
The failure to sustain above 23,840 and the vanishing futures premium are warning signs I cannot ignore.
While the trend remains bullish, the base-building process may require a healthy pullback to the 23,300 ~ 23,400 levels to invite fresh buyers.
For tomorrow, I will be watching the 23,840 zone very closely—a decisive close above it opens the doors to 24,000, but a failure there confirms the need for a retracement.
Stay alert and trade cautiously.
✏️ Disclaimer
This is my personal digital diary and represents my own analysis and point of view. It is not financial advice; please consult a professional advisor before making any trading decisions.

Read my blogs here:
substack.com/@kzatakia
Follow me on Telegram:
t.me/swingtraderhub
Follow me on X:
x.com/kzatakia
substack.com/@kzatakia
Follow me on Telegram:
t.me/swingtraderhub
Follow me on X:
x.com/kzatakia
Verbundene Veröffentlichungen
Haftungsausschluss
Die Informationen und Veröffentlichungen sind nicht als Finanz-, Anlage-, Handels- oder andere Arten von Ratschlägen oder Empfehlungen gedacht, die von TradingView bereitgestellt oder gebilligt werden, und stellen diese nicht dar. Lesen Sie mehr in den Nutzungsbedingungen.
Read my blogs here:
substack.com/@kzatakia
Follow me on Telegram:
t.me/swingtraderhub
Follow me on X:
x.com/kzatakia
substack.com/@kzatakia
Follow me on Telegram:
t.me/swingtraderhub
Follow me on X:
x.com/kzatakia
Verbundene Veröffentlichungen
Haftungsausschluss
Die Informationen und Veröffentlichungen sind nicht als Finanz-, Anlage-, Handels- oder andere Arten von Ratschlägen oder Empfehlungen gedacht, die von TradingView bereitgestellt oder gebilligt werden, und stellen diese nicht dar. Lesen Sie mehr in den Nutzungsbedingungen.