
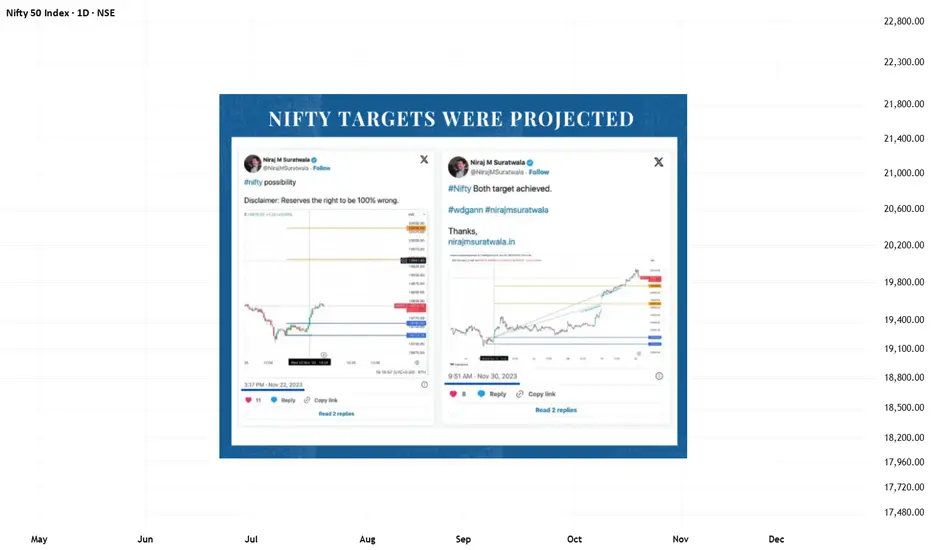
(22 Nov 2023 | Educational Gann Study)
This idea presents a historical, educational study of how Price–Time Square geometry, as described in classical WD Gann methodology, appeared on the Nifty 50 intraday structure.
The intent of this post is market structure analysis, not prediction or trading advice.
📌 Structural Context
On 22 November 2023, Nifty was trading within a defined intraday range after a prior swing.
According to Gann principles:
📈 What the Chart Illustrates
The chart highlights:
This example helps demonstrate how price symmetry and time balance can be studied objectively.
🧠 Key Takeaways
The emphasis is on process and discipline, not outcome.
⚠ Disclaimer
This idea is shared strictly for educational and analytical purposes.
It does not constitute financial advice, live calls, or recommendations.
This idea presents a historical, educational study of how Price–Time Square geometry, as described in classical WD Gann methodology, appeared on the Nifty 50 intraday structure.
The intent of this post is market structure analysis, not prediction or trading advice.
📌 Structural Context
On 22 November 2023, Nifty was trading within a defined intraday range after a prior swing.
According to Gann principles:
- Markets often respond to square relationships between price and time
- When price units align proportionally with time units, measurable reaction zones may appear
- These zones act as reference levels, not guarantees
📈 What the Chart Illustrates
The chart highlights:
- A reference base level used for structure measurement
- Two price–time proportional zones derived from square calculations
- Price movement interacting with these zones during the same session
This example helps demonstrate how price symmetry and time balance can be studied objectively.
🧠 Key Takeaways
- Gann analysis focuses on structure, not certainty
- Price–Time Squares help define potential reaction areas
- Risk control and confirmation remain essential
- Studying completed sessions improves future market awareness
The emphasis is on process and discipline, not outcome.
⚠ Disclaimer
This idea is shared strictly for educational and analytical purposes.
It does not constitute financial advice, live calls, or recommendations.

Verbundene Veröffentlichungen
Haftungsausschluss
Die Informationen und Veröffentlichungen sind nicht als Finanz-, Anlage-, Handels- oder andere Arten von Ratschlägen oder Empfehlungen gedacht, die von TradingView bereitgestellt oder gebilligt werden, und stellen diese nicht dar. Lesen Sie mehr in den Nutzungsbedingungen.