
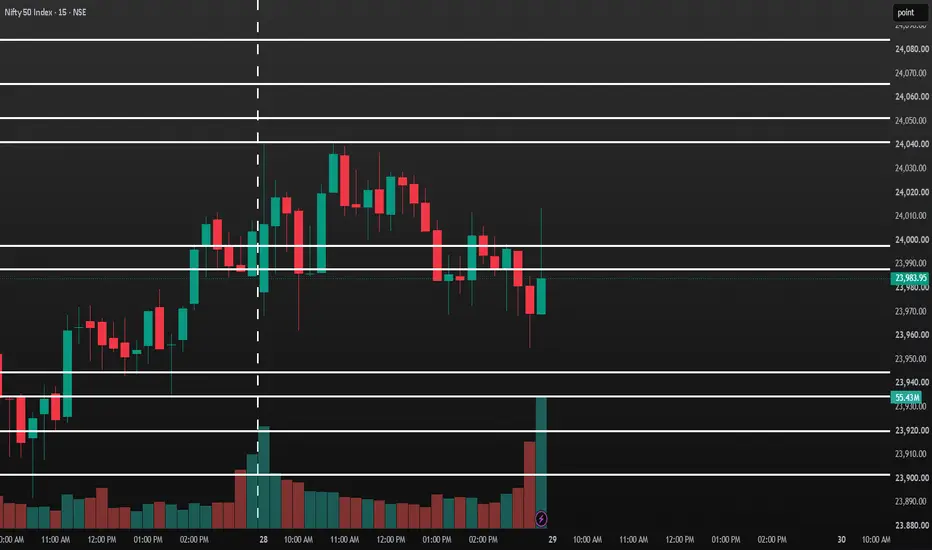
Key Technical Levels for July 29, 2026:
Support Levels:
Immediate Support: 23,950 – 23,962. This zone is anchored by Tuesday's intraday low, maintaining the stability of the current recovery.
Critical Floor: 23,800 – 23,850. Aligned with the 50-day Exponential Moving Average (EMA), this area serves as a robust structural demand zone.
Resistance Levels:
Immediate Hurdle: 24,041 – 24,050. This represents the immediate ceiling; a decisive breakout above this range would signal further upward momentum.
Major Ceiling: 24,100 – 24,150. This is the primary target area, where significant overhead call open interest begins to accumulate.
Support Levels:
Immediate Support: 23,950 – 23,962. This zone is anchored by Tuesday's intraday low, maintaining the stability of the current recovery.
Critical Floor: 23,800 – 23,850. Aligned with the 50-day Exponential Moving Average (EMA), this area serves as a robust structural demand zone.
Resistance Levels:
Immediate Hurdle: 24,041 – 24,050. This represents the immediate ceiling; a decisive breakout above this range would signal further upward momentum.
Major Ceiling: 24,100 – 24,150. This is the primary target area, where significant overhead call open interest begins to accumulate.

Haftungsausschluss
Die Informationen und Veröffentlichungen sind nicht als Finanz-, Anlage-, Handels- oder andere Arten von Ratschlägen oder Empfehlungen gedacht, die von TradingView bereitgestellt oder gebilligt werden, und stellen diese nicht dar. Lesen Sie mehr in den Nutzungsbedingungen.
Haftungsausschluss
Die Informationen und Veröffentlichungen sind nicht als Finanz-, Anlage-, Handels- oder andere Arten von Ratschlägen oder Empfehlungen gedacht, die von TradingView bereitgestellt oder gebilligt werden, und stellen diese nicht dar. Lesen Sie mehr in den Nutzungsbedingungen.