
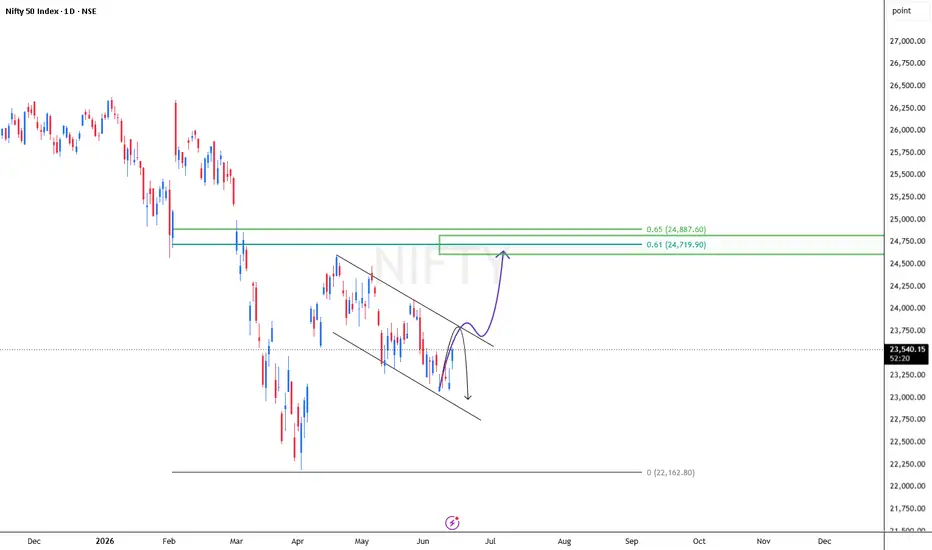
NIFTY Daily Chart Outlook
NIFTY is currently trading within a falling channel and approaching a key trendline resistance.
📈 Bullish Scenario
If NIFTY breaks above the descending trendline with strong momentum and sustains the breakout, it could trigger a move towards the 24,750 resistance zone.
This area also aligns with the 0.61–0.65 Fibonacci retracement zone, making it an important upside target.
📉 Bearish Scenario
If the index fails to break the trendline and faces rejection from current levels, selling pressure may resume.
In that case, NIFTY could revisit the 23,000 support zone.
🎯 Key Levels
Breakout Confirmation: Descending trendline resistance
Upside Target: 24,750
Downside Support: 23,000
Summary: A breakout above the falling channel could open the door for a rally towards 24,750, while rejection from the trendline may lead to another decline towards the 23,000 support area.
NIFTY is currently trading within a falling channel and approaching a key trendline resistance.
📈 Bullish Scenario
If NIFTY breaks above the descending trendline with strong momentum and sustains the breakout, it could trigger a move towards the 24,750 resistance zone.
This area also aligns with the 0.61–0.65 Fibonacci retracement zone, making it an important upside target.
📉 Bearish Scenario
If the index fails to break the trendline and faces rejection from current levels, selling pressure may resume.
In that case, NIFTY could revisit the 23,000 support zone.
🎯 Key Levels
Breakout Confirmation: Descending trendline resistance
Upside Target: 24,750
Downside Support: 23,000
Summary: A breakout above the falling channel could open the door for a rally towards 24,750, while rejection from the trendline may lead to another decline towards the 23,000 support area.

Haftungsausschluss
Die Informationen und Veröffentlichungen sind nicht als Finanz-, Anlage-, Handels- oder andere Arten von Ratschlägen oder Empfehlungen gedacht, die von TradingView bereitgestellt oder gebilligt werden, und stellen diese nicht dar. Lesen Sie mehr in den Nutzungsbedingungen.
Haftungsausschluss
Die Informationen und Veröffentlichungen sind nicht als Finanz-, Anlage-, Handels- oder andere Arten von Ratschlägen oder Empfehlungen gedacht, die von TradingView bereitgestellt oder gebilligt werden, und stellen diese nicht dar. Lesen Sie mehr in den Nutzungsbedingungen.