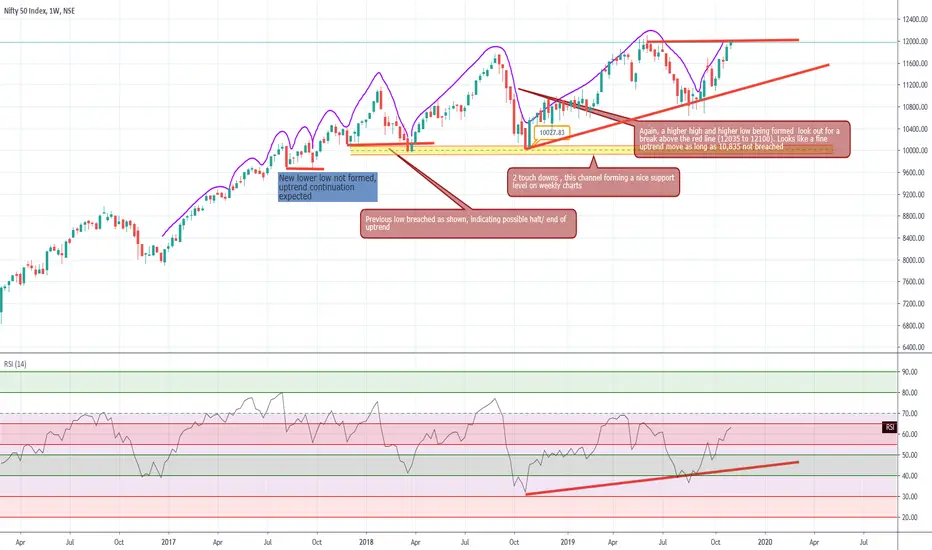
 NIFTY looks exciting on charts on weekly as well. If you see my H4 chart analysis, we saw we were in an uptrend and crucial levels for resistance.
On the weekly charts too, we seem to have entered a nice uptrend. Important zones and levels have been marked for your reference.
Play long Nifty for daily time frames should be along the trend trades
A good closure (higher high) this week or the following one should be encouraging and will continue the uptrend. Important to note, RSI is still not oversold.
If you like what you read, please share a thumbs up!
Cheers
Trade ist aktiv
Since the post, 9 weeks have elapsed. For the first 5 weeks, price tried to pierce the redline (12,013 levels) Bulls would move price higher and then the bears would try and pull them down. Since then, we have had 4 weeks of price closing above the red line now, but in the week ending 6th Jan 2020, we see the lows made during the week tested the red line, but bulls were quick to pull it over back in the green space price again flirting near all time highs!Watch out for my new post on this!

If you love what you see, pls share a thumbs up and a comment in the section below
Verbundene Veröffentlichungen
Haftungsausschluss
Die Informationen und Veröffentlichungen sind nicht als Finanz-, Anlage-, Handels- oder andere Arten von Ratschlägen oder Empfehlungen gedacht, die von TradingView bereitgestellt oder gebilligt werden, und stellen diese nicht dar. Lesen Sie mehr in den Nutzungsbedingungen.
If you love what you see, pls share a thumbs up and a comment in the section below
Verbundene Veröffentlichungen
Haftungsausschluss
Die Informationen und Veröffentlichungen sind nicht als Finanz-, Anlage-, Handels- oder andere Arten von Ratschlägen oder Empfehlungen gedacht, die von TradingView bereitgestellt oder gebilligt werden, und stellen diese nicht dar. Lesen Sie mehr in den Nutzungsbedingungen.