
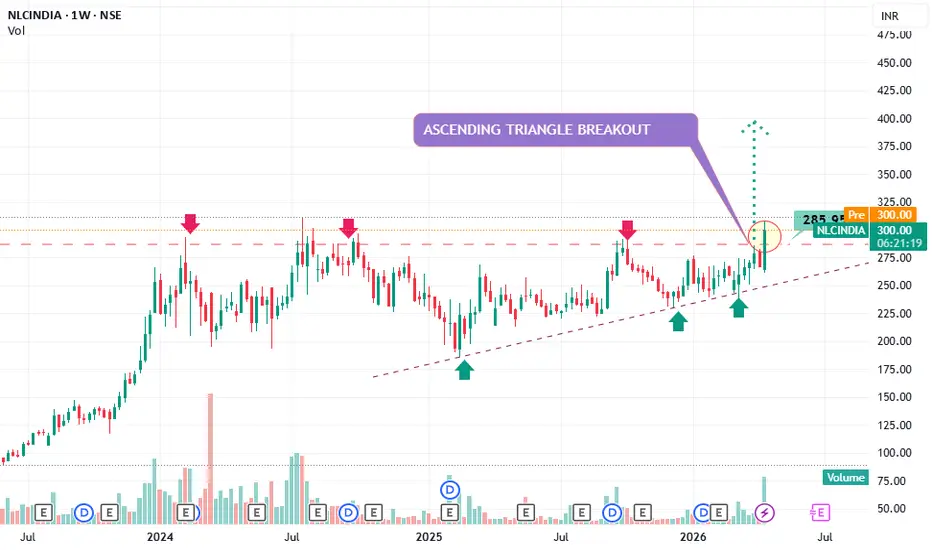
Flat resistance zone: ~₹285–₹290 (multiple rejections marked by red arrows)
Rising trendline: Higher lows (green arrows) showing accumulation
This pattern signals buyers getting stronger over time
👉 Classic bullish continuation setup.
Breakout Confirmation
Price has closed above resistance (~₹285)
Strong bullish candle with volume support (46M+)
This is not a fake breakout — structure + volume both aligned
Targets (Based on Pattern Projection)
Immediate target: ₹320–₹330
Measured move target: ₹360–₹380
Stretch target (momentum rally): ₹400+
Risk Management
Ideal Stop Loss: ₹270 (below breakout zone)
Aggressive traders: ₹275
📊 What Makes This Trade Strong?
Multi-month consolidation breakout
Higher lows = institutional accumulation
PSU power sector showing strength
Clean technical structure (easy to manage risk
Conservative traders: Wait for retest near ₹285
Rising trendline: Higher lows (green arrows) showing accumulation
This pattern signals buyers getting stronger over time
👉 Classic bullish continuation setup.
Breakout Confirmation
Price has closed above resistance (~₹285)
Strong bullish candle with volume support (46M+)
This is not a fake breakout — structure + volume both aligned
Targets (Based on Pattern Projection)
Immediate target: ₹320–₹330
Measured move target: ₹360–₹380
Stretch target (momentum rally): ₹400+
Risk Management
Ideal Stop Loss: ₹270 (below breakout zone)
Aggressive traders: ₹275
📊 What Makes This Trade Strong?
Multi-month consolidation breakout
Higher lows = institutional accumulation
PSU power sector showing strength
Clean technical structure (easy to manage risk
Conservative traders: Wait for retest near ₹285

Haftungsausschluss
Die Informationen und Veröffentlichungen sind nicht als Finanz-, Anlage-, Handels- oder andere Arten von Ratschlägen oder Empfehlungen gedacht, die von TradingView bereitgestellt oder gebilligt werden, und stellen diese nicht dar. Lesen Sie mehr in den Nutzungsbedingungen.
Haftungsausschluss
Die Informationen und Veröffentlichungen sind nicht als Finanz-, Anlage-, Handels- oder andere Arten von Ratschlägen oder Empfehlungen gedacht, die von TradingView bereitgestellt oder gebilligt werden, und stellen diese nicht dar. Lesen Sie mehr in den Nutzungsbedingungen.