
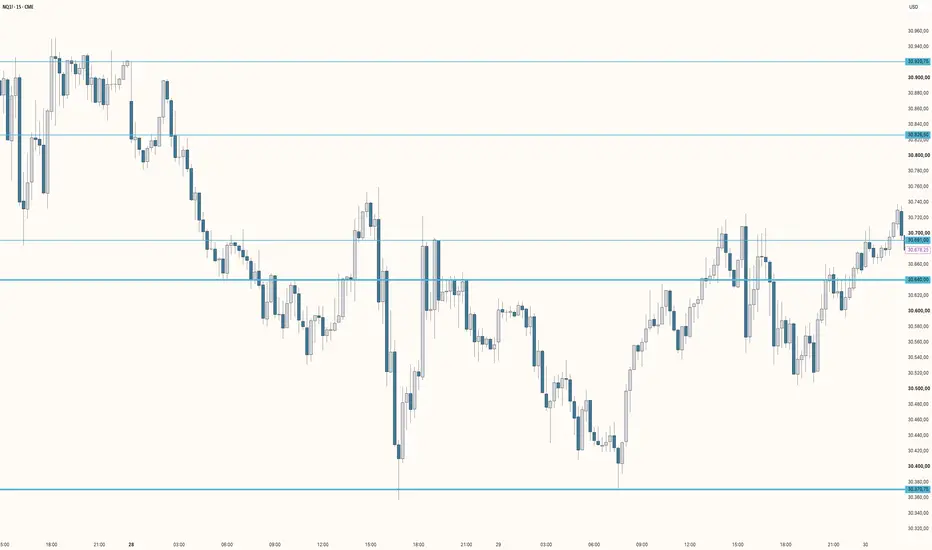
Self-Similarity Without Repetition: A Different Way to Think About Market Structure
Why recurring patterns are not enough and how variation, context, and mathematical synthesis can change the way we analyze price.
Why I Stopped Looking for One Perfect Rule
When I began studying financial markets, I wanted to understand their behavior rather than memorize another trading strategy. I investigated moving averages, support and resistance, Fibonacci ratios, candlestick patterns, waves, and many other familiar ideas. Eventually I learned to program, partly because implementing a concept forces every attractive explanation to become an explicit rule that can actually be examined.
That process changed how I thought about trading. A method could look persuasive in one environment and fail in another. One moving average seemed relevant for a while, only to lose that role as conditions changed. A price range could hold repeatedly and then break decisively. Contradictory interpretations could each describe a different aspect of the same chart.
I did not conclude that every conventional approach was useless. I began to question the expectation behind many of them: Why should a constantly changing market consistently respect one exact shape, one preferred distance, or one fixed setting?
The question I wanted to answer became more fundamental: What remains recognizable when price structures vary in size, duration, appearance, and cause?
Fractals: Similarity Does Not Mean an Identical Copy
Benoît Mandelbrot's work on fractal geometry offered a different starting point. Fractals are often presented through spectacular mathematical images or the familiar example of a coastline. But the idea that mattered most to me was self-similarity: related organization can appear at different scales without each part becoming a perfect duplicate of the whole.
Look at the branching of a tree, a system of blood vessels, or the airways of a lung. Individual branches differ in length, width, orientation, and proportions. Yet within limited ranges of scale, their organization can display recognizable statistical or geometric relationships. Real biological structures are neither infinite mathematical fractals nor exact copies at every level. Their variation is essential to their form.
The distinction is simple but important: repetition is not the same as self-similarity. Searching only for an exact repeat may overlook relevant structural relationships. At the other extreme, calling every roughly familiar shape a fractal makes the idea impossible to test.
It is also worth separating this mathematical meaning from a common trading term. A local high whose neighboring highs are lower may be called a “fractal” on many charts. It is a useful pivot definition, but three neighboring candles do not, by themselves, demonstrate fractal scaling in the underlying price process.
A Hypothesis About Human Systems and Markets
The wider significance of fractal geometry, for me, does not begin with a price chart. Fractal-like organization appears in biological, natural, and other complex systems. Humans are part of those systems; financial markets are created by human decisions, interactions, institutions, and technology. Even an automated trading algorithm has rules, objectives, and infrastructure designed by people.
That led me to a working hypothesis: a market, as an emergent complex system, may continue to express related structural principles even as individual decisions, participants, technologies, and market conditions change. The surface can look radically different while recurring relationships remain worth searching for.
I see those principles as a possible source of order within apparent chaos. I am not saying that every candle follows one predetermined shape, that a pattern appears simultaneously on all timeframes, or that the next market turn must occur at a precise ratio. My hypothesis concerns the persistence of possible structural organization within variation.
This distinction is necessary. The presence of fractal properties in anatomy does not mathematically prove that all human-created systems inherit a universal fractal law. Nor does a recognizable shape across two timeframes demonstrate that their price distributions are identical. The proposed connection from natural structures to markets is my interpretation and a motivation for analysis, not an established theorem.
Mandelbrot's financial research supplies a more specific foundation. His 1963 work questioned conventional models of speculative price changes. Later multifractal work examined heavy tails, dependence in the magnitude of returns, and scaling behavior across time intervals. Those findings invite us to study markets across scales; they do not turn a particular chart pattern into a guaranteed forecast.
Why Exact Patterns Can Be the Wrong Question
Consider two charts with the price and time axes hidden. One might depict minutes and the other weeks. Both may contain a range, a breakout, a retracement, and a subsequent expansion. From appearance alone, it can be hard to tell the difference. But a visual resemblance does not establish identical statistical properties. Very short intervals, for example, can be affected by market microstructure in ways larger intervals are not.
What this example suggests to me is not that all timeframes are interchangeable. It is that the scale of a movement can change while certain relationships remain interpretable.
A rigid rule can miss that distinction. A retracement may stop near a familiar Fibonacci level today and somewhere else tomorrow. One EMA length may be informative in one condition and less informative in another. A fixed distance of twenty points may describe an extraordinary move in one instrument and almost nothing in another.
There is no need to discard these methods. The mistake is treating any of them as an exclusive answer. Variation should be part of the model rather than an inconvenience that must be eliminated.
From Pattern Recognition to Structural Synthesis
This is where my thinking diverges most strongly from simply drawing fractal-looking shapes or projecting a sequence of future Fibonacci targets.
Instead of asking which exact pattern the market will repeat, I ask where different ways of measuring the market reveal compatible structural information.
Those perspectives need not agree at an identical price. In fact, they answer different questions:
There are two ways these perspectives can be brought together. Some can be combined mathematically into a new calculated structure. For example, by defining boundaries that retain actual price information while also incorporating smoothed data. Others can remain separate and be interpreted in relation to one another. For example, observing what happens when price approaches a historical level near a volatility-adjusted boundary.
This is not a vote in which five indicators say “bullish” and three say “bearish.” It is also not always a simple arithmetic average. Sometimes a useful common denominator is a range, sometimes a boundary, sometimes a relationship between values that do not perfectly coincide. The point is to preserve what each method contributes while looking for shared structure.
A familiar analogy is reading a sentence with a misspelled word. We often recognize its likely meaning because the surrounding context and several imperfect clues support the interpretation. We do not demand a perfect letter-for-letter match. The comparison is an analogy about context and tolerance, not proof that language or trading operates according to the same fractal mathematics.
A Practical Example: Location Before Direction
Imagine a rapid decline. Conventional candles show strong bearish momentum. That information is real, but by itself it says little about where the move is occurring relative to other structural references.
Now consider three additional observations. The decline reaches a price area established during earlier trading. Its distance from a central price reference is unusually large relative to recent volatility. Meanwhile, a smoothed range-based representation begins showing that the downward expansion is losing persistence.
These measurements are not three independent prophecies. They are different descriptions of a developing situation. Together, they identify a location where the next reaction may be especially informative.
At this point, I would not automatically conclude that the market must reverse. The price could reject the area, pause, or break through and continue falling. The important question becomes what the actual price does at that location, including where the candle closes and whether the developing structure supports or contradicts the initial expectation.
If price rebounds and structural evidence improves, a bullish interpretation becomes more plausible. If support breaks and the decline continues, that same observation argues against the bullish case. The method should change its interpretation when the facts change.
This is what I mean by reaction over prediction. I am not trying to identify a mathematical command that the market must obey. I am trying to create a perspective that can follow an evolving structure without assuming its outcome.
Why the Calculations Must Adapt
Once we accept that self-similar structure can vary, we need to reconsider fixed settings. An instrument's price scale, the selected timeframe, and the current volatility all change what counts as a large or small movement.
An adaptive method can derive distances from recent volatility, incorporate observations across more than one calculation length, and combine actual prices with smoothed values. Such choices aim to keep the interpretation responsive without demanding a new manually optimized preset for every symbol or interval.
That does not mean every input should be removed or that dynamic calculations automatically work equally well everywhere. A method can be adaptive and still be wrong. Its value must ultimately be judged by how clearly it describes price behavior and, if trading performance is claimed, by appropriate testing.
I also distinguish a mathematical combination from a merely decorative collection of indicators. Adding more lines can add visual noise without creating better information. A useful design should perform the difficult calculations behind the scenes and display only the structural relationships that matter to the intended analysis.
What This Approach Does, and Does Not Establish
Fractal thinking is an intellectual foundation, not proof of a universal trading edge. Several methods can appear to confirm one another while largely recycling the same OHLC data. A volatility-adjusted reference may be more transferable across instruments than a fixed distance, but transferability is not the same as predictive accuracy.
To evaluate an implementation seriously, I would ask whether the observed relationships survive unseen data, different market regimes, changes in volatility, and realistic trading costs. I would also ask when its information becomes available, whether confirmed values change afterward, and which assumptions break down during unusual market events.
These questions do not weaken the underlying idea. They are how a useful hypothesis becomes a method worth trusting. or one that needs further work. The goal is not to prove that the market agrees with a theory at all times. The goal is to let market evidence correct the interpretation.
Conclusion: Order Within Variation
My central conviction is that recurring structural organization can exist without identical repetition. That conviction began with Mandelbrot and the broader presence of self-similarity in complex natural systems. In markets, it led me away from searching for one perfect pattern and toward combining different mathematical views, allowing flexible measurements, and evaluating what price actually does.
The ambition is not to predict a specific future shape. It is to recognize meaningful structure while that shape is still evolving.
Different perspectives. Shared structures. Interpretation through reaction, not certainty.
Selected References
This article is provided for educational and informational purposes only. It explores mathematical concepts, scientific research, and personal interpretations of market behavior. The ideas and examples presented are intended to encourage critical thinking and further research, not to provide financial advice, trading recommendations, or guarantees of future market behavior.
Financial markets involve risk, and no analytical method can eliminate uncertainty or guarantee profitable outcomes. Readers should conduct their own research and make independent financial decisions.
Why recurring patterns are not enough and how variation, context, and mathematical synthesis can change the way we analyze price.
Why I Stopped Looking for One Perfect Rule
When I began studying financial markets, I wanted to understand their behavior rather than memorize another trading strategy. I investigated moving averages, support and resistance, Fibonacci ratios, candlestick patterns, waves, and many other familiar ideas. Eventually I learned to program, partly because implementing a concept forces every attractive explanation to become an explicit rule that can actually be examined.
That process changed how I thought about trading. A method could look persuasive in one environment and fail in another. One moving average seemed relevant for a while, only to lose that role as conditions changed. A price range could hold repeatedly and then break decisively. Contradictory interpretations could each describe a different aspect of the same chart.
I did not conclude that every conventional approach was useless. I began to question the expectation behind many of them: Why should a constantly changing market consistently respect one exact shape, one preferred distance, or one fixed setting?
The question I wanted to answer became more fundamental: What remains recognizable when price structures vary in size, duration, appearance, and cause?
Fractals: Similarity Does Not Mean an Identical Copy
Benoît Mandelbrot's work on fractal geometry offered a different starting point. Fractals are often presented through spectacular mathematical images or the familiar example of a coastline. But the idea that mattered most to me was self-similarity: related organization can appear at different scales without each part becoming a perfect duplicate of the whole.
Look at the branching of a tree, a system of blood vessels, or the airways of a lung. Individual branches differ in length, width, orientation, and proportions. Yet within limited ranges of scale, their organization can display recognizable statistical or geometric relationships. Real biological structures are neither infinite mathematical fractals nor exact copies at every level. Their variation is essential to their form.
The distinction is simple but important: repetition is not the same as self-similarity. Searching only for an exact repeat may overlook relevant structural relationships. At the other extreme, calling every roughly familiar shape a fractal makes the idea impossible to test.
It is also worth separating this mathematical meaning from a common trading term. A local high whose neighboring highs are lower may be called a “fractal” on many charts. It is a useful pivot definition, but three neighboring candles do not, by themselves, demonstrate fractal scaling in the underlying price process.
A Hypothesis About Human Systems and Markets
The wider significance of fractal geometry, for me, does not begin with a price chart. Fractal-like organization appears in biological, natural, and other complex systems. Humans are part of those systems; financial markets are created by human decisions, interactions, institutions, and technology. Even an automated trading algorithm has rules, objectives, and infrastructure designed by people.
That led me to a working hypothesis: a market, as an emergent complex system, may continue to express related structural principles even as individual decisions, participants, technologies, and market conditions change. The surface can look radically different while recurring relationships remain worth searching for.
I see those principles as a possible source of order within apparent chaos. I am not saying that every candle follows one predetermined shape, that a pattern appears simultaneously on all timeframes, or that the next market turn must occur at a precise ratio. My hypothesis concerns the persistence of possible structural organization within variation.
This distinction is necessary. The presence of fractal properties in anatomy does not mathematically prove that all human-created systems inherit a universal fractal law. Nor does a recognizable shape across two timeframes demonstrate that their price distributions are identical. The proposed connection from natural structures to markets is my interpretation and a motivation for analysis, not an established theorem.
Mandelbrot's financial research supplies a more specific foundation. His 1963 work questioned conventional models of speculative price changes. Later multifractal work examined heavy tails, dependence in the magnitude of returns, and scaling behavior across time intervals. Those findings invite us to study markets across scales; they do not turn a particular chart pattern into a guaranteed forecast.
Why Exact Patterns Can Be the Wrong Question
Consider two charts with the price and time axes hidden. One might depict minutes and the other weeks. Both may contain a range, a breakout, a retracement, and a subsequent expansion. From appearance alone, it can be hard to tell the difference. But a visual resemblance does not establish identical statistical properties. Very short intervals, for example, can be affected by market microstructure in ways larger intervals are not.
What this example suggests to me is not that all timeframes are interchangeable. It is that the scale of a movement can change while certain relationships remain interpretable.
A rigid rule can miss that distinction. A retracement may stop near a familiar Fibonacci level today and somewhere else tomorrow. One EMA length may be informative in one condition and less informative in another. A fixed distance of twenty points may describe an extraordinary move in one instrument and almost nothing in another.
There is no need to discard these methods. The mistake is treating any of them as an exclusive answer. Variation should be part of the model rather than an inconvenience that must be eliminated.
From Pattern Recognition to Structural Synthesis
This is where my thinking diverges most strongly from simply drawing fractal-looking shapes or projecting a sequence of future Fibonacci targets.
Instead of asking which exact pattern the market will repeat, I ask where different ways of measuring the market reveal compatible structural information.
Those perspectives need not agree at an identical price. In fact, they answer different questions:
- Actual price extremes describe where the market has traded and how far a move reached.
- Smoothed price calculations can expose persistence and reduce the influence of small fluctuations, but may hide some extremes.
- Ranges and structural breaks describe whether a move remains inside a previous area or establishes a new one.
- Volatility-derived distances help express movement relative to market conditions rather than a fixed point value.
- Historical volume or price levels provide references from previous activity, not necessarily forecasts of the next reaction.
There are two ways these perspectives can be brought together. Some can be combined mathematically into a new calculated structure. For example, by defining boundaries that retain actual price information while also incorporating smoothed data. Others can remain separate and be interpreted in relation to one another. For example, observing what happens when price approaches a historical level near a volatility-adjusted boundary.
This is not a vote in which five indicators say “bullish” and three say “bearish.” It is also not always a simple arithmetic average. Sometimes a useful common denominator is a range, sometimes a boundary, sometimes a relationship between values that do not perfectly coincide. The point is to preserve what each method contributes while looking for shared structure.
A familiar analogy is reading a sentence with a misspelled word. We often recognize its likely meaning because the surrounding context and several imperfect clues support the interpretation. We do not demand a perfect letter-for-letter match. The comparison is an analogy about context and tolerance, not proof that language or trading operates according to the same fractal mathematics.
A Practical Example: Location Before Direction
Imagine a rapid decline. Conventional candles show strong bearish momentum. That information is real, but by itself it says little about where the move is occurring relative to other structural references.
Now consider three additional observations. The decline reaches a price area established during earlier trading. Its distance from a central price reference is unusually large relative to recent volatility. Meanwhile, a smoothed range-based representation begins showing that the downward expansion is losing persistence.
These measurements are not three independent prophecies. They are different descriptions of a developing situation. Together, they identify a location where the next reaction may be especially informative.
At this point, I would not automatically conclude that the market must reverse. The price could reject the area, pause, or break through and continue falling. The important question becomes what the actual price does at that location, including where the candle closes and whether the developing structure supports or contradicts the initial expectation.
If price rebounds and structural evidence improves, a bullish interpretation becomes more plausible. If support breaks and the decline continues, that same observation argues against the bullish case. The method should change its interpretation when the facts change.
This is what I mean by reaction over prediction. I am not trying to identify a mathematical command that the market must obey. I am trying to create a perspective that can follow an evolving structure without assuming its outcome.
Why the Calculations Must Adapt
Once we accept that self-similar structure can vary, we need to reconsider fixed settings. An instrument's price scale, the selected timeframe, and the current volatility all change what counts as a large or small movement.
An adaptive method can derive distances from recent volatility, incorporate observations across more than one calculation length, and combine actual prices with smoothed values. Such choices aim to keep the interpretation responsive without demanding a new manually optimized preset for every symbol or interval.
That does not mean every input should be removed or that dynamic calculations automatically work equally well everywhere. A method can be adaptive and still be wrong. Its value must ultimately be judged by how clearly it describes price behavior and, if trading performance is claimed, by appropriate testing.
I also distinguish a mathematical combination from a merely decorative collection of indicators. Adding more lines can add visual noise without creating better information. A useful design should perform the difficult calculations behind the scenes and display only the structural relationships that matter to the intended analysis.
What This Approach Does, and Does Not Establish
Fractal thinking is an intellectual foundation, not proof of a universal trading edge. Several methods can appear to confirm one another while largely recycling the same OHLC data. A volatility-adjusted reference may be more transferable across instruments than a fixed distance, but transferability is not the same as predictive accuracy.
To evaluate an implementation seriously, I would ask whether the observed relationships survive unseen data, different market regimes, changes in volatility, and realistic trading costs. I would also ask when its information becomes available, whether confirmed values change afterward, and which assumptions break down during unusual market events.
These questions do not weaken the underlying idea. They are how a useful hypothesis becomes a method worth trusting. or one that needs further work. The goal is not to prove that the market agrees with a theory at all times. The goal is to let market evidence correct the interpretation.
Conclusion: Order Within Variation
My central conviction is that recurring structural organization can exist without identical repetition. That conviction began with Mandelbrot and the broader presence of self-similarity in complex natural systems. In markets, it led me away from searching for one perfect pattern and toward combining different mathematical views, allowing flexible measurements, and evaluating what price actually does.
The ambition is not to predict a specific future shape. It is to recognize meaningful structure while that shape is still evolving.
Different perspectives. Shared structures. Interpretation through reaction, not certainty.
Selected References
- Mandelbrot, B. (1963). The Variation of Certain Speculative Prices. The Journal of Business, 36(4), 394–419.
- Weibel, E. R. (1991). Fractal Geometry: A Design Principle for Living Organisms. American Journal of Physiology, 261, L361–L369.
- Mandelbrot, B., Fisher, A. & Calvet, L. (1997). A Multifractal Model of Asset Returns. Cowles Foundation Discussion Paper No. 1164, Yale University.
This article is provided for educational and informational purposes only. It explores mathematical concepts, scientific research, and personal interpretations of market behavior. The ideas and examples presented are intended to encourage critical thinking and further research, not to provide financial advice, trading recommendations, or guarantees of future market behavior.
Financial markets involve risk, and no analytical method can eliminate uncertainty or guarantee profitable outcomes. Readers should conduct their own research and make independent financial decisions.

Haftungsausschluss
Die Informationen und Veröffentlichungen sind nicht als Finanz-, Anlage-, Handels- oder andere Arten von Ratschlägen oder Empfehlungen gedacht, die von TradingView bereitgestellt oder gebilligt werden, und stellen diese nicht dar. Lesen Sie mehr in den Nutzungsbedingungen.
Haftungsausschluss
Die Informationen und Veröffentlichungen sind nicht als Finanz-, Anlage-, Handels- oder andere Arten von Ratschlägen oder Empfehlungen gedacht, die von TradingView bereitgestellt oder gebilligt werden, und stellen diese nicht dar. Lesen Sie mehr in den Nutzungsbedingungen.