
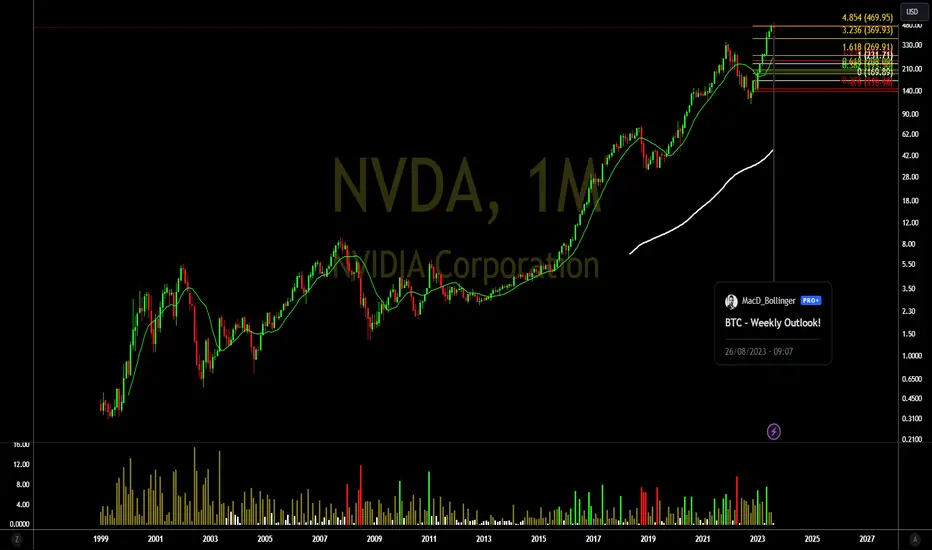
-Hello. This was the high pivot of the NVDA asset that the SETUP I used pointed out on the monthly chart.

-When prices reach the "Triple Golden" region, it will suggest that prices are fully stretched. Now I ask. Are prices stretched too high?
-Correcting to the region of 269.61 would be the most sensible for the moment, since the company wants to buy back its shares, so, I think, it has no more projects.
-Am I going crazy?
-From the daily chart, I don't even know if I should call the candle on 08/24/2023 a shooting star, because to me it really looks like a meteor.
-As the prices are stretched so I think they need to correct.

-Do your analysis and good business.
-Be Aware, If You Buy, Use Stop Loss.
-See below for other graphic reviews!
-When prices reach the "Triple Golden" region, it will suggest that prices are fully stretched. Now I ask. Are prices stretched too high?
-Correcting to the region of 269.61 would be the most sensible for the moment, since the company wants to buy back its shares, so, I think, it has no more projects.
-Am I going crazy?
-From the daily chart, I don't even know if I should call the candle on 08/24/2023 a shooting star, because to me it really looks like a meteor.
-As the prices are stretched so I think they need to correct.
-Do your analysis and good business.
-Be Aware, If You Buy, Use Stop Loss.
-See below for other graphic reviews!

Verbundene Veröffentlichungen
Haftungsausschluss
Die Informationen und Veröffentlichungen sind nicht als Finanz-, Anlage-, Handels- oder andere Arten von Ratschlägen oder Empfehlungen gedacht, die von TradingView bereitgestellt oder gebilligt werden, und stellen diese nicht dar. Lesen Sie mehr in den Nutzungsbedingungen.
Verbundene Veröffentlichungen
Haftungsausschluss
Die Informationen und Veröffentlichungen sind nicht als Finanz-, Anlage-, Handels- oder andere Arten von Ratschlägen oder Empfehlungen gedacht, die von TradingView bereitgestellt oder gebilligt werden, und stellen diese nicht dar. Lesen Sie mehr in den Nutzungsbedingungen.