
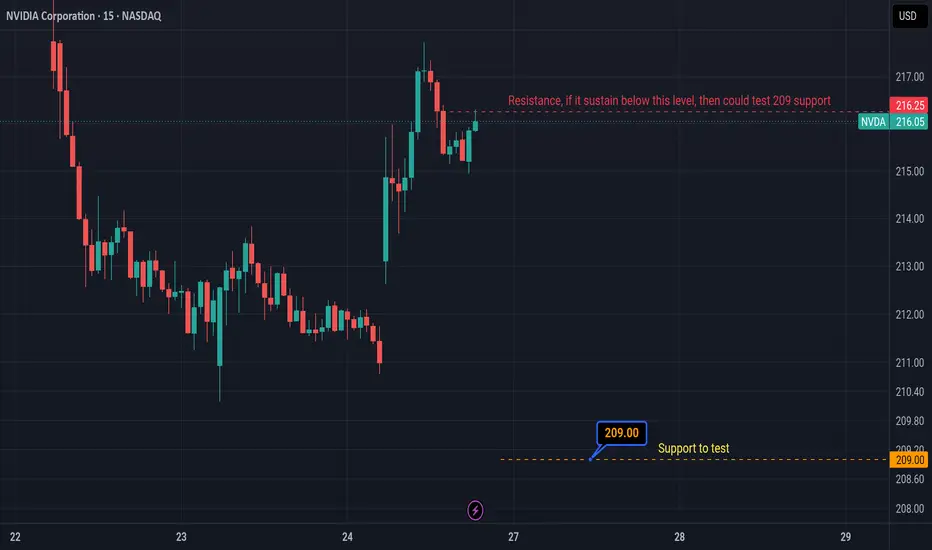
NVDA 15m: Intraday Distribution and Rotation to Support Plan
• Ticker: NVDA (NVIDIA Corporation) via NASDAQ
• Timeframe: 15-Minute (15m)
• Current Price: 215.91 USD (+0.05 / +0.02%)
Key Technical Levels
• Overhead Resistance Target: 216.25 USD (Major structural ceiling labeled on the chart as: "Resistance, if it sustain below this level, then could test 209 support").
• Defined Support Base: 209.00 USD (The major horizontal target floor marked by the label: "209.00 Support to test").
Market Analysis & Structural Outlook
• Price Action: Following a sharp intraday recovery that pushed back toward the upper value distribution blocks, NVDA established a tight consolidation range. However, upward expansion is encountering intense supply density right underneath the primary overhead structural resistance zone.
• Current Framework: The asset is holding its short-term local pivots but is facing clean structural rejections. The inability of price action to expand past the 216.25 USD structural shelf signals that a localized distribution phase is currently maturing.
• Execution Projection: If price action continues to face overhead rejections and sustains positions underneath this major 216.25 USD resistance ceiling, a short-term bearish rotation leg is projected to develop. This structural layout maps out a potential downward expansion to flush near-term momentum buyers and retest the major horizontal support baseline resting at the 209.00 USD level.
Legal Compliance & Financial Disclaimer
This analysis is published strictly for educational and informational purposes only. It does not constitute financial, investment, trading, or legal advice. Trading equity derivatives and spot contracts carries a high level of risk and may not be suitable for all investors. Before deciding to allocate capital, you should carefully consider your investment objectives, level of experience, and risk appetite. Past performance is not indicative of future market results. You should execute your own independent research before placing capital at risk in live financial markets. The author assumes no liability for any financial loss incurred directly or indirectly from the use of this information.
Trade geschlossen: Ziel wurde erreicht
Educational Follow-Up / Structural Update• The Framework: The technical framework mapped out in the original short study has completely resolved its downward structural rotation.
• Price Action Resolution: As observed, the breakdown below the 209.00 USD level sustained absolute seller control and extended aggressively into a severe downside liquidation leg.
• Target Met: This bearish expansion resulted in a clean downward drive to breach the major horizontal support ceiling, passing below the 209.00 USD level to register a final session floor near 202.00 USD before minor buying interest arrived.

Haftungsausschluss
Die Informationen und Veröffentlichungen sind nicht als Finanz-, Anlage-, Handels- oder andere Arten von Ratschlägen oder Empfehlungen gedacht, die von TradingView bereitgestellt oder gebilligt werden, und stellen diese nicht dar. Lesen Sie mehr in den Nutzungsbedingungen.
Haftungsausschluss
Die Informationen und Veröffentlichungen sind nicht als Finanz-, Anlage-, Handels- oder andere Arten von Ratschlägen oder Empfehlungen gedacht, die von TradingView bereitgestellt oder gebilligt werden, und stellen diese nicht dar. Lesen Sie mehr in den Nutzungsbedingungen.