
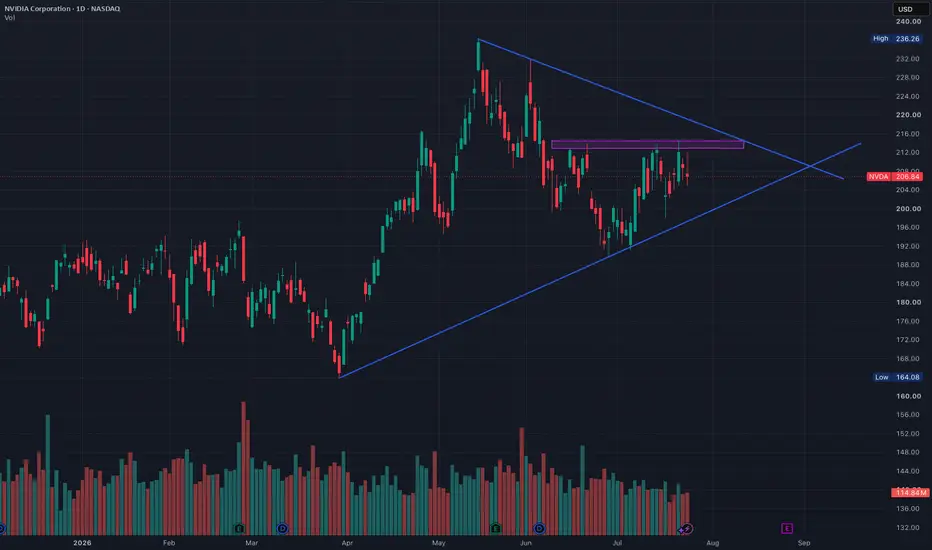
Since the May high at 236, every bounce has been rejected at a lower price. Sellers are stepping in earlier each time (the falling trendline). Since the April low at 164, dips have been bought at higher prices. Buyers are stepping in earlier too (the rising trendline). Price even broke below the rising line briefly in late June, but buyers took it back within the same trading day. That is a sign of the line acting as a support. Now price is caught in the middle around 207, and the space between the lines is shrinking every week. There also seems to be a resistance zone at 212.5–214, where price has been rejected three times since June.
A triangle squeeze like this doesn't guarantee a big move. Triangles can fake out or fizzle. But it does set up a good risk-reward trade: whichever direction price breaks, the invalidation point is nearby, while the potential move is much larger. The two trendlines meet around the end of August, right around Nvidia's next earnings, so the breakout or breakdown from this triangle could line up with big event news.
For now, the chart looks neutral. There is no clear trend. On a daily close above 214, the chart starts to look bullish, and a further break above the falling trendline would strengthen the up move. On the downside, a daily close below the rising trendline (currently around 200) would be the first warning that the triangle is failing. A daily close below the early July low near 191 would make the chart look quite bearish.
I will update this idea when the break happens.
Not financial advice, just my own analysis.
A triangle squeeze like this doesn't guarantee a big move. Triangles can fake out or fizzle. But it does set up a good risk-reward trade: whichever direction price breaks, the invalidation point is nearby, while the potential move is much larger. The two trendlines meet around the end of August, right around Nvidia's next earnings, so the breakout or breakdown from this triangle could line up with big event news.
For now, the chart looks neutral. There is no clear trend. On a daily close above 214, the chart starts to look bullish, and a further break above the falling trendline would strengthen the up move. On the downside, a daily close below the rising trendline (currently around 200) would be the first warning that the triangle is failing. A daily close below the early July low near 191 would make the chart look quite bearish.
I will update this idea when the break happens.
Not financial advice, just my own analysis.
Trade ist aktiv
Update: Price has broken below the triangle, closing under the rising trendline for two days in a row. In my original post this was the first warning level for the downside. Now that the price has broken below, this looks like a good spot for a short trade, because the invalidation is close by, while the targets are much larger, making for a good risk:reward ratio.Stop loss: A daily close back inside the triangle, above the broken trendline (currently around 198.5-199).
Price targets would be as follows:
- The first target is around 191, targeting the July low, which also lines up with the 200-day EMA, currently at 190-191.
- Then the low-180s area is the second target. If the selling really accelerates, the early-April low at 164 is the final target.
A daily close below 191 would confirm the breakdown and strengthen the bearish case.
The main risk is a fakeout like late June. That is exactly why the stop loss is a daily close back inside, not just a quick wick above the line.
Not financial advice, just my own analysis.

Follow me on TradingView for more upcoming ideas!
Haftungsausschluss
Die Informationen und Veröffentlichungen sind nicht als Finanz-, Anlage-, Handels- oder andere Arten von Ratschlägen oder Empfehlungen gedacht, die von TradingView bereitgestellt oder gebilligt werden, und stellen diese nicht dar. Lesen Sie mehr in den Nutzungsbedingungen.
Follow me on TradingView for more upcoming ideas!
Haftungsausschluss
Die Informationen und Veröffentlichungen sind nicht als Finanz-, Anlage-, Handels- oder andere Arten von Ratschlägen oder Empfehlungen gedacht, die von TradingView bereitgestellt oder gebilligt werden, und stellen diese nicht dar. Lesen Sie mehr in den Nutzungsbedingungen.