
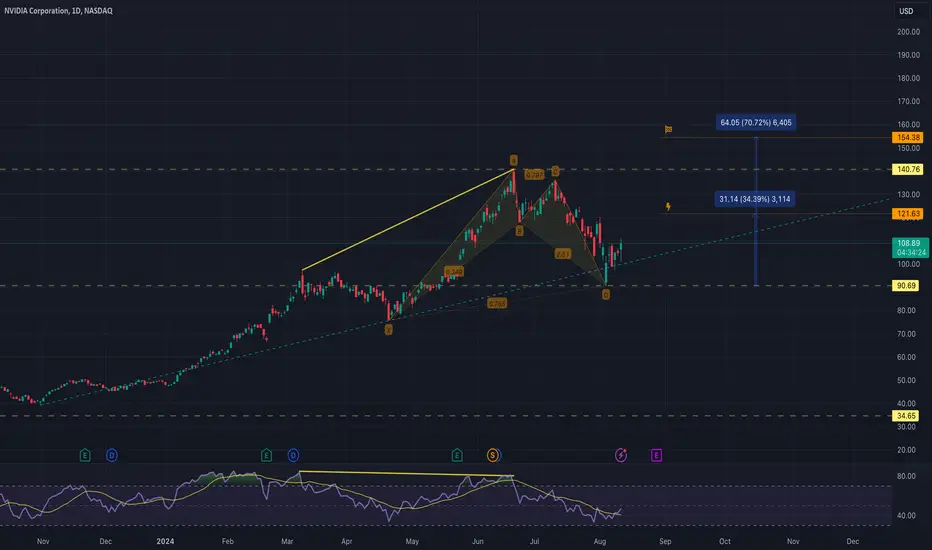
#Nvda 1D chart;
Continues its 8-month steady rise from the beginning of the year to today
It had given the first bearish signal with its divergence in the $140 zone, which is the Ath level.
As of the $90 level, the bullish pattern started and the target points are as in the chart.
Continues its 8-month steady rise from the beginning of the year to today
It had given the first bearish signal with its divergence in the $140 zone, which is the Ath level.
As of the $90 level, the bullish pattern started and the target points are as in the chart.

For more you can follow me on X. @UgurTash
Haftungsausschluss
Die Informationen und Veröffentlichungen sind nicht als Finanz-, Anlage-, Handels- oder andere Arten von Ratschlägen oder Empfehlungen gedacht, die von TradingView bereitgestellt oder gebilligt werden, und stellen diese nicht dar. Lesen Sie mehr in den Nutzungsbedingungen.
For more you can follow me on X. @UgurTash
Haftungsausschluss
Die Informationen und Veröffentlichungen sind nicht als Finanz-, Anlage-, Handels- oder andere Arten von Ratschlägen oder Empfehlungen gedacht, die von TradingView bereitgestellt oder gebilligt werden, und stellen diese nicht dar. Lesen Sie mehr in den Nutzungsbedingungen.