

"NZDCAD: the last impulse of the down move?" by ThinkingAntsOk
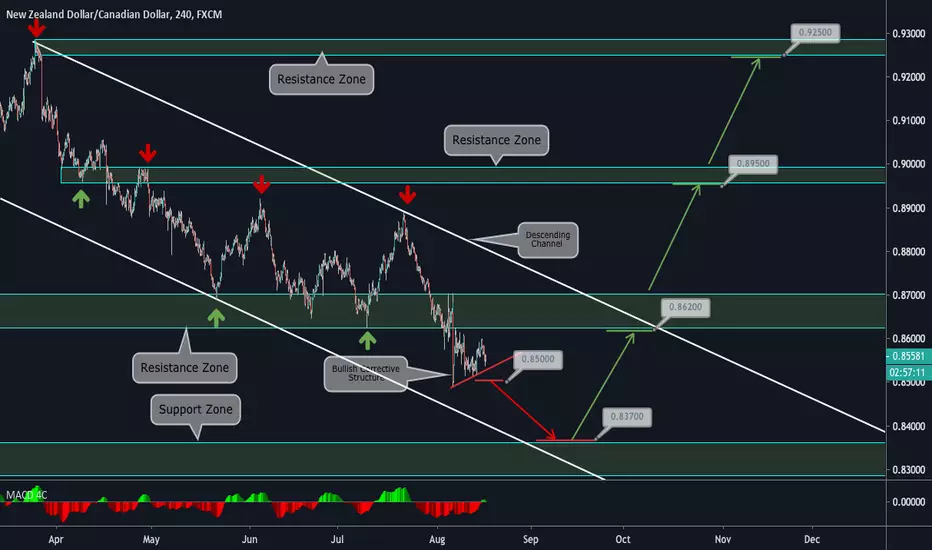
4H CHART EXPLANATION:
- In Weekly Terms, we observe a lateralization in this instrument since 2014.
- In April 19', it started its down move towards the level in which it is now.
- Price is on an a Descending Channel.
- It is currently on a Bearish Corrective Structure. If it breaks it at 0,85, it has potential to move down towards the Support Zone at 0,837.
- After this, we expect price to move up.
Check out our Weekly and Daily Vision, that support our short idea!
Weekly Vision:

Daily Vision:

- In Weekly Terms, we observe a lateralization in this instrument since 2014.
- In April 19', it started its down move towards the level in which it is now.
- Price is on an a Descending Channel.
- It is currently on a Bearish Corrective Structure. If it breaks it at 0,85, it has potential to move down towards the Support Zone at 0,837.
- After this, we expect price to move up.
Check out our Weekly and Daily Vision, that support our short idea!
Weekly Vision:
Daily Vision:

Haftungsausschluss
Die Informationen und Veröffentlichungen sind nicht als Finanz-, Anlage-, Handels- oder andere Arten von Ratschlägen oder Empfehlungen gedacht, die von TradingView bereitgestellt oder gebilligt werden, und stellen diese nicht dar. Lesen Sie mehr in den Nutzungsbedingungen.
Haftungsausschluss
Die Informationen und Veröffentlichungen sind nicht als Finanz-, Anlage-, Handels- oder andere Arten von Ratschlägen oder Empfehlungen gedacht, die von TradingView bereitgestellt oder gebilligt werden, und stellen diese nicht dar. Lesen Sie mehr in den Nutzungsbedingungen.