

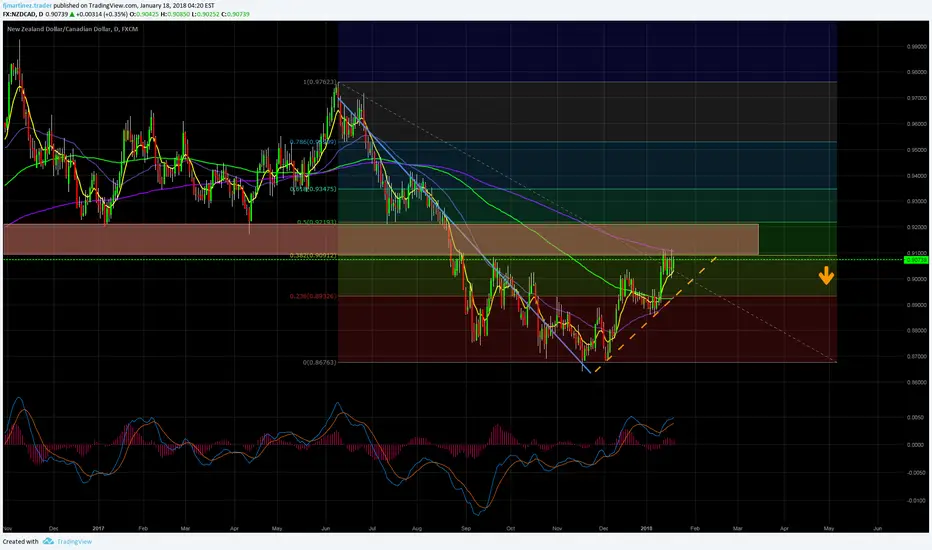
With the NZDCAD we have the reverse situation as I writed in the EURAUD analysis , it is in an downward rally, is inside correction and is finding an historic support area coinciding with fibonacci level of 38% and is touching the 300 WMA. It could be a signal showing the end of the correction.
I draw a trend line (Orange line) and if it is crossed downward and the 150 WMA (Green) is crossed too, I'll open a sell order with:
- Partial close 0.8710
- Stop loss 0.9260.
- Last partial close, moving the stop loss.
Remember:
You Never should convert a Winning position into a lossing position
I draw a trend line (Orange line) and if it is crossed downward and the 150 WMA (Green) is crossed too, I'll open a sell order with:
- Partial close 0.8710
- Stop loss 0.9260.
- Last partial close, moving the stop loss.
Remember:
You Never should convert a Winning position into a lossing position

Haftungsausschluss
Die Informationen und Veröffentlichungen sind nicht als Finanz-, Anlage-, Handels- oder andere Arten von Ratschlägen oder Empfehlungen gedacht, die von TradingView bereitgestellt oder gebilligt werden, und stellen diese nicht dar. Lesen Sie mehr in den Nutzungsbedingungen.
Haftungsausschluss
Die Informationen und Veröffentlichungen sind nicht als Finanz-, Anlage-, Handels- oder andere Arten von Ratschlägen oder Empfehlungen gedacht, die von TradingView bereitgestellt oder gebilligt werden, und stellen diese nicht dar. Lesen Sie mehr in den Nutzungsbedingungen.