

NZD/CAD:SELL From 61.8% FIBO Resistance AREA DIV RSI SHORT
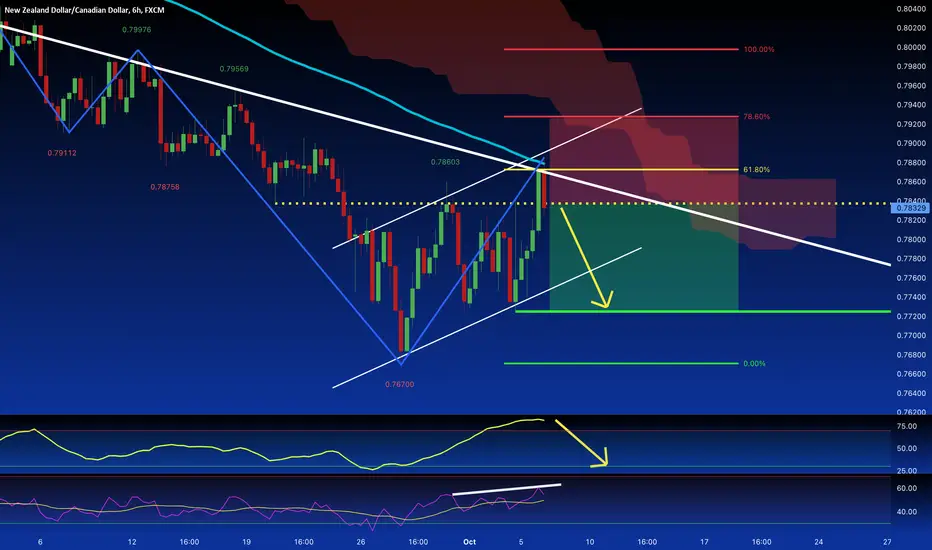
NZD/CAD comes from a solid bearish trend, in the last sessions, the price had a retracement to the 61.8% Fibonacci retracement whereas today the market opened with a strong bearish candle. At this price, the level is placed some static resistance and the dynamic trendline. The 100 Moving average had worked like a rebound point where the candle turned bearish and the indicators, the RSI ( in divergence ), and the Stochastic show a drop-down pattern.
Anmerkung

Haftungsausschluss
Die Informationen und Veröffentlichungen sind nicht als Finanz-, Anlage-, Handels- oder andere Arten von Ratschlägen oder Empfehlungen gedacht, die von TradingView bereitgestellt oder gebilligt werden, und stellen diese nicht dar. Lesen Sie mehr in den Nutzungsbedingungen.
Haftungsausschluss
Die Informationen und Veröffentlichungen sind nicht als Finanz-, Anlage-, Handels- oder andere Arten von Ratschlägen oder Empfehlungen gedacht, die von TradingView bereitgestellt oder gebilligt werden, und stellen diese nicht dar. Lesen Sie mehr in den Nutzungsbedingungen.