

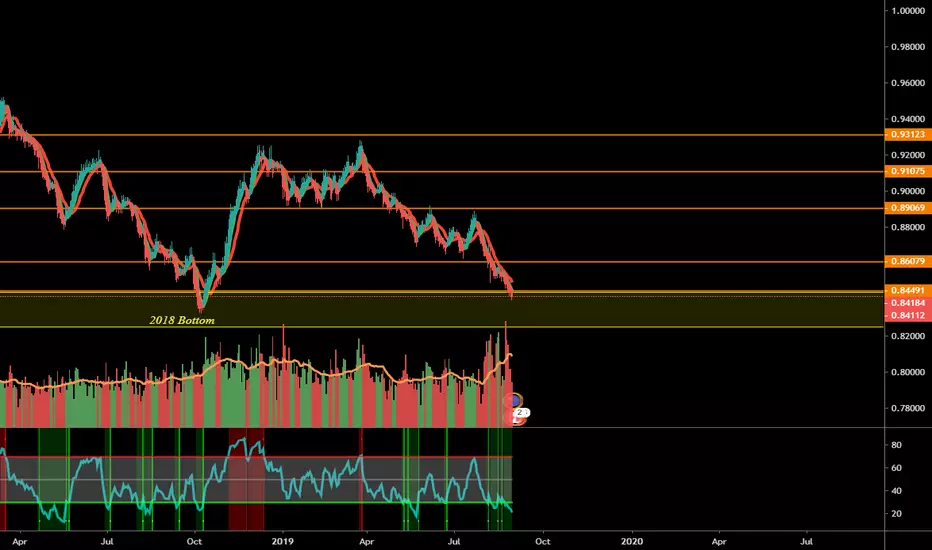
NZD/CAD after finding the bottom in OCT-2018 it did 918 pips within 63 Days.
As it was also the same bottom back there in Sep-2015 and with 459 Days it did above 1600 pips.
Now it is testing the same area which can also be considered as the triple bottom
At least expecting 500 Pips in the long term from here.
Note- Wait for a bullish crossover, Rsi showing uptrend!
As it was also the same bottom back there in Sep-2015 and with 459 Days it did above 1600 pips.
Now it is testing the same area which can also be considered as the triple bottom
At least expecting 500 Pips in the long term from here.
Note- Wait for a bullish crossover, Rsi showing uptrend!

Haftungsausschluss
Die Informationen und Veröffentlichungen sind nicht als Finanz-, Anlage-, Handels- oder andere Arten von Ratschlägen oder Empfehlungen gedacht, die von TradingView bereitgestellt oder gebilligt werden, und stellen diese nicht dar. Lesen Sie mehr in den Nutzungsbedingungen.
Haftungsausschluss
Die Informationen und Veröffentlichungen sind nicht als Finanz-, Anlage-, Handels- oder andere Arten von Ratschlägen oder Empfehlungen gedacht, die von TradingView bereitgestellt oder gebilligt werden, und stellen diese nicht dar. Lesen Sie mehr in den Nutzungsbedingungen.