OmiseGo ready to Pump!? ,( OMG/BTC Analysis ) 📈📉
Hello traders, what's going on today ?!
Since 14 Mar 2021, that I posted the last analysis for OmiseGo (OMGUSDT) , it has had a lot UPs and down ,
although it wasn't able to reach my dream target , but it was able see my second tp for 2 time by recording a HH
, but then declined as others altcoin !====================>>>>>>>>( tp1 more than 500%💰 (1x)long).)
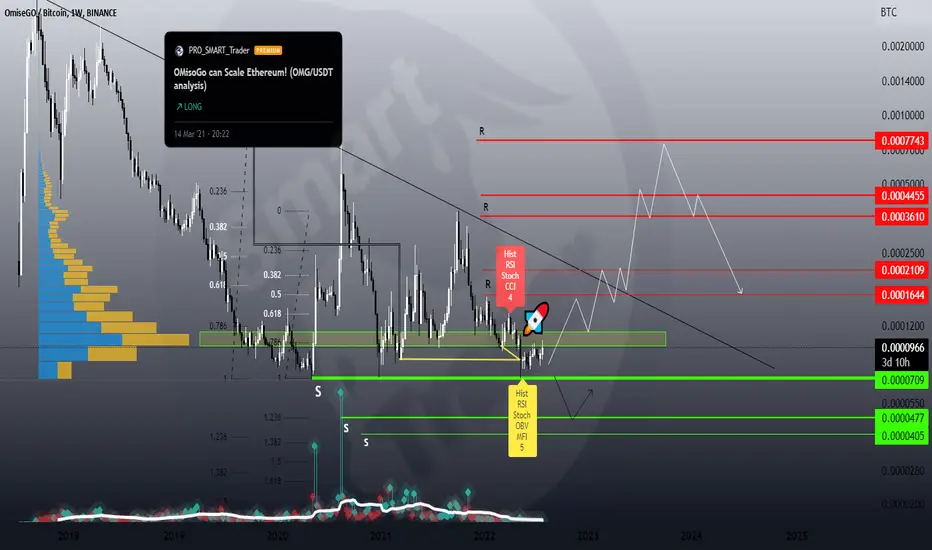
today as you see on the weekly timeframe again for OMG/BTC pair , it is already trading underneath of an important pivot zone and over a demand zone , also
we can see some positive divergences ( Hist ,RSI, Stoch, OBV
and Mfi ) which are a compactly bullish sign for a possible take off rally for OMG , if it be able to over come the pivot zone so then it can easily reach the higher R levels and descending trend line , and if be able to break out this trend line can even see the higher resistance lvl, but otherwise it may forms a lower low and and see the lower support lvls , as a bear trap , then sharply jump ! so take care!
✌️ Good luck with your trading and investing and remember: Trade smart…OR JUST DON’T TRADE!
--------------------------------------------------------------------------------------------------------------------
👉This analysis is my personal opinion ,not a financial advice ,so do your own research.
💜 if you're fan of my analyses please follow me , give a big thumbs 👍 OR drop a comment 🗯
Since 14 Mar 2021, that I posted the last analysis for OmiseGo (OMGUSDT) , it has had a lot UPs and down ,
although it wasn't able to reach my dream target , but it was able see my second tp for 2 time by recording a HH
, but then declined as others altcoin !====================>>>>>>>>( tp1 more than 500%💰 (1x)long).)
today as you see on the weekly timeframe again for OMG/BTC pair , it is already trading underneath of an important pivot zone and over a demand zone , also
we can see some positive divergences ( Hist ,RSI, Stoch, OBV
and Mfi ) which are a compactly bullish sign for a possible take off rally for OMG , if it be able to over come the pivot zone so then it can easily reach the higher R levels and descending trend line , and if be able to break out this trend line can even see the higher resistance lvl, but otherwise it may forms a lower low and and see the lower support lvls , as a bear trap , then sharply jump ! so take care!
✌️ Good luck with your trading and investing and remember: Trade smart…OR JUST DON’T TRADE!
--------------------------------------------------------------------------------------------------------------------
👉This analysis is my personal opinion ,not a financial advice ,so do your own research.
💜 if you're fan of my analyses please follow me , give a big thumbs 👍 OR drop a comment 🗯

Verbundene Veröffentlichungen
Haftungsausschluss
Die Informationen und Veröffentlichungen sind nicht als Finanz-, Anlage-, Handels- oder andere Arten von Ratschlägen oder Empfehlungen gedacht, die von TradingView bereitgestellt oder gebilligt werden, und stellen diese nicht dar. Lesen Sie mehr in den Nutzungsbedingungen.
Verbundene Veröffentlichungen
Haftungsausschluss
Die Informationen und Veröffentlichungen sind nicht als Finanz-, Anlage-, Handels- oder andere Arten von Ratschlägen oder Empfehlungen gedacht, die von TradingView bereitgestellt oder gebilligt werden, und stellen diese nicht dar. Lesen Sie mehr in den Nutzungsbedingungen.