Aktualisiert
Pattern analysis for OMG coin.
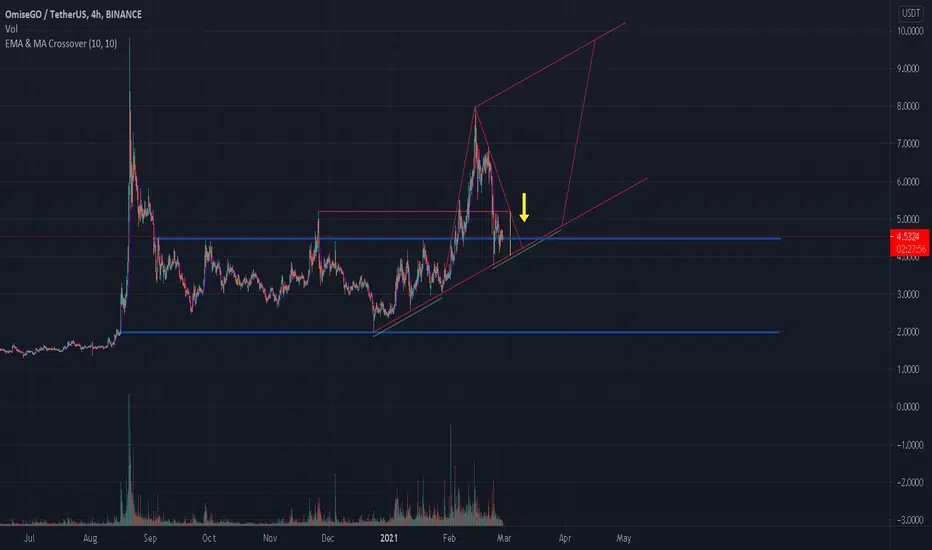
Once price reaches yellow line, it will become a crucial period and price should be followed(by you) through until it reaches the two red lines intersecting one another (yellow arrow) on 9th of March.
This will determine whether price will go up, which could take a few weeks until it reaches its previous all time high in september 2020.
If price doesn't stay above the support line after it crosses the two intersecting lines(yellow arrow), it is likely the coin will stay between the two blue lines while bouncing back and forth for upto few months.
Analysis was made for a follower as per their request.
Working on eth and btc analysis after this unless someone wants me to analyse a coin for them.
Thank you.
*DO NOT TAKE MY ANALYSIS TO SELL/BUY COINS*
*MARKETS ARE VOLATILE AND PREDICTING PRICE MOVEMENT IS IMPOSSIBLE*.
This will determine whether price will go up, which could take a few weeks until it reaches its previous all time high in september 2020.
If price doesn't stay above the support line after it crosses the two intersecting lines(yellow arrow), it is likely the coin will stay between the two blue lines while bouncing back and forth for upto few months.
Analysis was made for a follower as per their request.
Working on eth and btc analysis after this unless someone wants me to analyse a coin for them.
Thank you.
*DO NOT TAKE MY ANALYSIS TO SELL/BUY COINS*
*MARKETS ARE VOLATILE AND PREDICTING PRICE MOVEMENT IS IMPOSSIBLE*.
Anmerkung
Chart is looking very good in my opion! Just like everything else! Goodluck!
Anmerkung
Hey guys, looks like we finally broke resistance and stayed above the support!If price stay above current support, we should be seeing a nice slow positive trend until April, which is when we might see a bigger price movement, only if we stay above support. Hopefully, it can be sooner and breaks previous trend.
I'm still very new to this, i need more information on how price acts. Whether it changes pattern every month or not. It would be very helpful I'm used to few months of analysis on crypto. So, i can make more accurate predictions in future.

Haftungsausschluss
Die Informationen und Veröffentlichungen sind nicht als Finanz-, Anlage-, Handels- oder andere Arten von Ratschlägen oder Empfehlungen gedacht, die von TradingView bereitgestellt oder gebilligt werden, und stellen diese nicht dar. Lesen Sie mehr in den Nutzungsbedingungen.
Haftungsausschluss
Die Informationen und Veröffentlichungen sind nicht als Finanz-, Anlage-, Handels- oder andere Arten von Ratschlägen oder Empfehlungen gedacht, die von TradingView bereitgestellt oder gebilligt werden, und stellen diese nicht dar. Lesen Sie mehr in den Nutzungsbedingungen.