3 Months of Consolidation… Is ONDO Ready to Move?
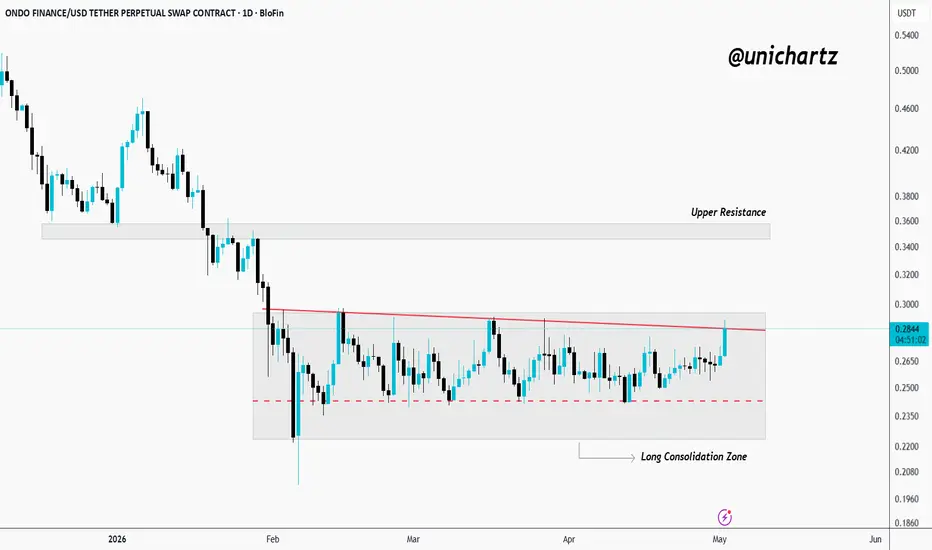
The daily chart of OONDO/USDT displays price attempting to test the top of a 3-month range consolidation. After a period ranging from $0.22 to $0.29, price is trying to break above a descending red trendline that has consistently provided resistance.
If ONDO successfully breaks this, then price should move towards its main resistance target at $0.35.
DYOR, NFA
If ONDO successfully breaks this, then price should move towards its main resistance target at $0.35.
DYOR, NFA
Trade ist aktiv
 ONDO IS NOW UP BY 33%
Daily Free Signals :bit.ly/UnichartzAlpha
Register on Bitunix and trade with me: 👇
bitunix.com/register?vipCode=coEA
Register on Bitunix and trade with me: 👇
bitunix.com/register?vipCode=coEA
Haftungsausschluss
Die Informationen und Veröffentlichungen sind nicht als Finanz-, Anlage-, Handels- oder andere Arten von Ratschlägen oder Empfehlungen gedacht, die von TradingView bereitgestellt oder gebilligt werden, und stellen diese nicht dar. Lesen Sie mehr in den Nutzungsbedingungen.
Daily Free Signals :bit.ly/UnichartzAlpha
Register on Bitunix and trade with me: 👇
bitunix.com/register?vipCode=coEA
Register on Bitunix and trade with me: 👇
bitunix.com/register?vipCode=coEA
Haftungsausschluss
Die Informationen und Veröffentlichungen sind nicht als Finanz-, Anlage-, Handels- oder andere Arten von Ratschlägen oder Empfehlungen gedacht, die von TradingView bereitgestellt oder gebilligt werden, und stellen diese nicht dar. Lesen Sie mehr in den Nutzungsbedingungen.