
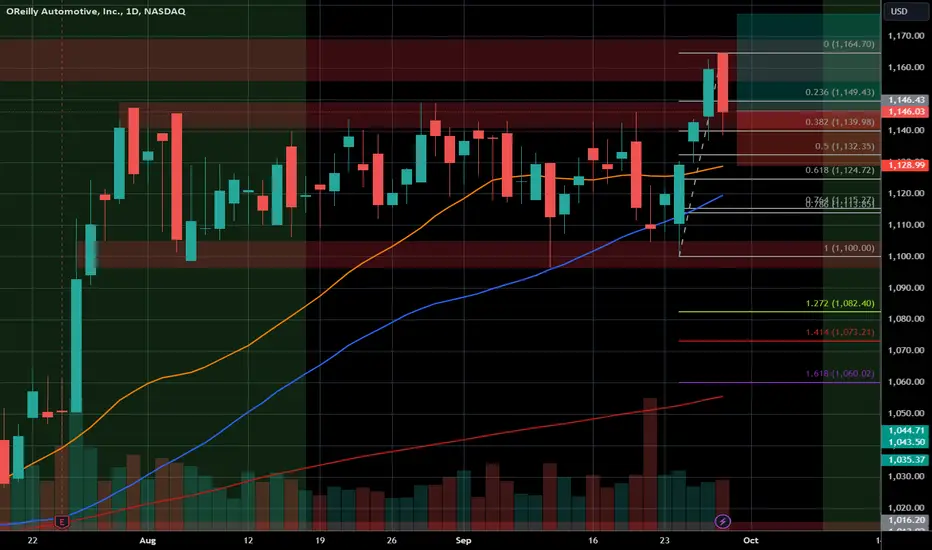
I've entered a long position in $ORLY. Since this US stock reached its high in late July of this year, it has been continuously in a sideways correction, which is very bullish. In the last few trading days, it broke out of this channel to the upside and re-tested it on the last trading day.
The price is currently supported by the 38.2% Fibonacci level, the upper boundary of the broken channel, and the moving averages are catching up.
Let's see if this setup plays out as expected.
The price is currently supported by the 38.2% Fibonacci level, the upper boundary of the broken channel, and the moving averages are catching up.
Let's see if this setup plays out as expected.
Trade wurde manuell geschlossen
Closed the position with a green 0
Haftungsausschluss
Die Informationen und Veröffentlichungen sind nicht als Finanz-, Anlage-, Handels- oder andere Arten von Ratschlägen oder Empfehlungen gedacht, die von TradingView bereitgestellt oder gebilligt werden, und stellen diese nicht dar. Lesen Sie mehr in den Nutzungsbedingungen.
Haftungsausschluss
Die Informationen und Veröffentlichungen sind nicht als Finanz-, Anlage-, Handels- oder andere Arten von Ratschlägen oder Empfehlungen gedacht, die von TradingView bereitgestellt oder gebilligt werden, und stellen diese nicht dar. Lesen Sie mehr in den Nutzungsbedingungen.