
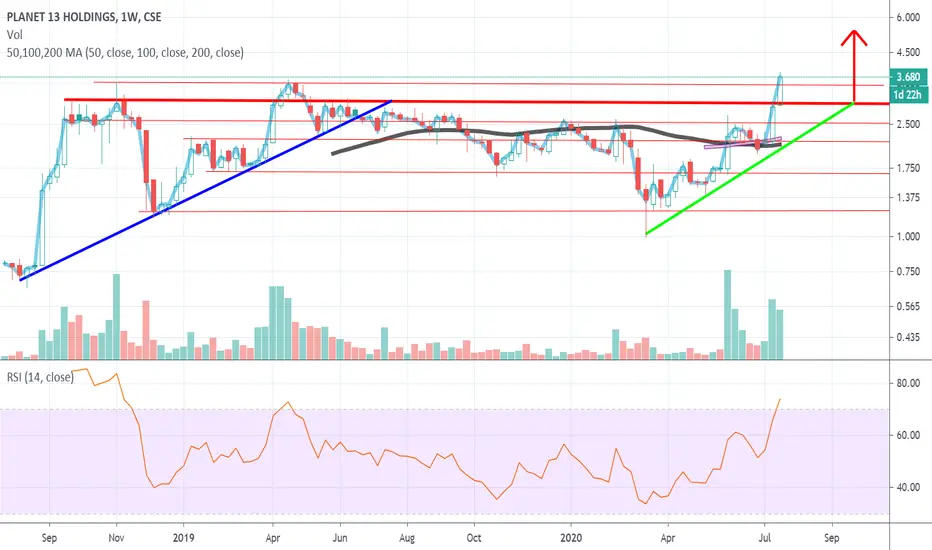
Planet 13 Holdings is displaying a strong breakout of a Ascending Triangle.
Notice the difference in higher high creation on the RSI of this Ascending Triangle compared to the previous one in 2018 & early 2020 that played out bearishly.
I have colored the upward sloping support Blue on the previous ascending triangle, as opposed to Green on the current ascending triangle pattern breakout.
This chart is done on a log scale.

Haftungsausschluss
Die Informationen und Veröffentlichungen sind nicht als Finanz-, Anlage-, Handels- oder andere Arten von Ratschlägen oder Empfehlungen gedacht, die von TradingView bereitgestellt oder gebilligt werden, und stellen diese nicht dar. Lesen Sie mehr in den Nutzungsbedingungen.
Haftungsausschluss
Die Informationen und Veröffentlichungen sind nicht als Finanz-, Anlage-, Handels- oder andere Arten von Ratschlägen oder Empfehlungen gedacht, die von TradingView bereitgestellt oder gebilligt werden, und stellen diese nicht dar. Lesen Sie mehr in den Nutzungsbedingungen.