
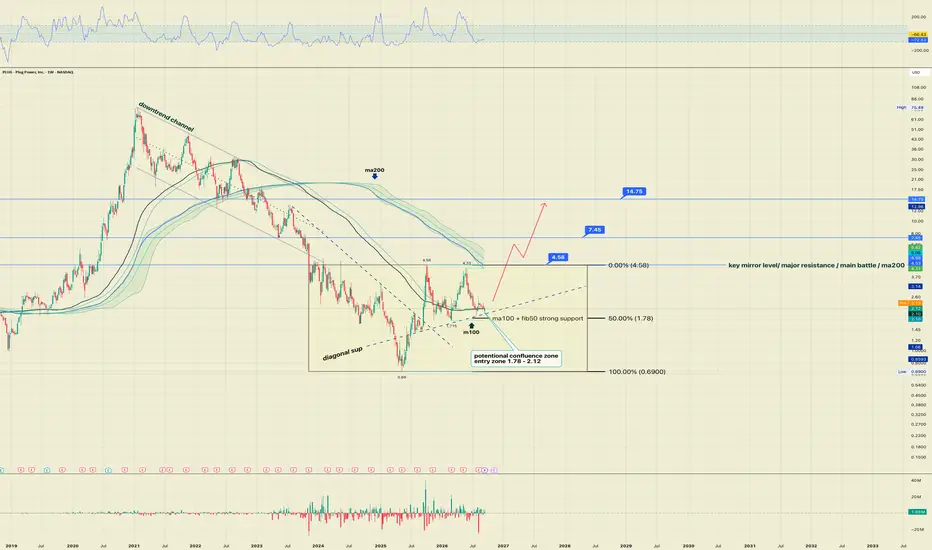
PLUG has been under heavy selling pressure for a long time. Following a multi-year protracted decline, a key structural shift occurred in November 2023 when the price broke below the lower boundary of the global downtrend channel. This breakdown was a major manipulation designed to shake out weak hands and capture short liquidity, triggering a final wave of capitulation where the market hammered out an absolute macro bottom at $0.69 [PLUG]. This flush out completely reset the old bearish cycle and launched a massive reversal base, where smart money has been systematically absorbing market supply via limit orders from late 2023 to the present day $PLUG.
This multi-year base forms a complex accumulation structure. The ascending dotted line (diagonal sup) has proven its absolute validity, acting as the primary dynamic axis holding the entire chart geometry together. Currently, the price is compressed within a local confluence zone of $1.78–$2.12. This is the most critical battleground for buyers to defend their positions, as it marks the intersection of the 50.00% Fibonacci retracement level ($1.78), the heavy 100-week moving average (ma100), and the dynamic support line. The $1.78–$2.12 area is the primary zone where the market must show a strong bullish reaction if the long-term base scenario is to remain valid. Crucially, this is not a guaranteed bottom. If the price closes the week below $1.55, the base structure will be compromised, the limit barrier broken, and the bullish thesis completely invalidated. A major headwind to keep in mind is the fundamental context — the company's high cash burn rate, which keeps Wall Street consensus conservative with intermediate targets set around $3.50–$5.00.
Overhead lies the absolute ultimate technical barrier of the macro structure — the key mirror resistance level at $4.58, which aligns with the heavy 200-week moving average (MA200). This is the "main battle" and the upper boundary of the multi-year base. As long as the price remains below it, the stock continues to trade within the global accumulation phase. A clean breakout and confirmation above $4.58 will fundamentally shift the technical landscape on a macro scale. Piercing through this heavy supply wall will trigger a massive short squeeze, confirm an official exit from the accumulation base, and unleash three years of coiled energy, clearing the path toward structural targets at $7.45 and a long-term macro target of $14.75.
This publication is for analytical purposes only and does not constitute individual investment advice. Technical levels are scenarios, not guarantees of price movement.
This multi-year base forms a complex accumulation structure. The ascending dotted line (diagonal sup) has proven its absolute validity, acting as the primary dynamic axis holding the entire chart geometry together. Currently, the price is compressed within a local confluence zone of $1.78–$2.12. This is the most critical battleground for buyers to defend their positions, as it marks the intersection of the 50.00% Fibonacci retracement level ($1.78), the heavy 100-week moving average (ma100), and the dynamic support line. The $1.78–$2.12 area is the primary zone where the market must show a strong bullish reaction if the long-term base scenario is to remain valid. Crucially, this is not a guaranteed bottom. If the price closes the week below $1.55, the base structure will be compromised, the limit barrier broken, and the bullish thesis completely invalidated. A major headwind to keep in mind is the fundamental context — the company's high cash burn rate, which keeps Wall Street consensus conservative with intermediate targets set around $3.50–$5.00.
Overhead lies the absolute ultimate technical barrier of the macro structure — the key mirror resistance level at $4.58, which aligns with the heavy 200-week moving average (MA200). This is the "main battle" and the upper boundary of the multi-year base. As long as the price remains below it, the stock continues to trade within the global accumulation phase. A clean breakout and confirmation above $4.58 will fundamentally shift the technical landscape on a macro scale. Piercing through this heavy supply wall will trigger a massive short squeeze, confirm an official exit from the accumulation base, and unleash three years of coiled energy, clearing the path toward structural targets at $7.45 and a long-term macro target of $14.75.
This publication is for analytical purposes only and does not constitute individual investment advice. Technical levels are scenarios, not guarantees of price movement.

📊 Trader | Analysis & Trade Ideas
📲 Telegram → t.me/totoshkatradingteam
FxPro → direct.start-fxpro.finance/ru/partner/SwHtc7m3
AMarkets → profit-market.info/promo/?g=BZA6ZC
📲 Telegram → t.me/totoshkatradingteam
FxPro → direct.start-fxpro.finance/ru/partner/SwHtc7m3
AMarkets → profit-market.info/promo/?g=BZA6ZC
Verbundene Veröffentlichungen
Haftungsausschluss
Die Informationen und Veröffentlichungen sind nicht als Finanz-, Anlage-, Handels- oder andere Arten von Ratschlägen oder Empfehlungen gedacht, die von TradingView bereitgestellt oder gebilligt werden, und stellen diese nicht dar. Lesen Sie mehr in den Nutzungsbedingungen.
📊 Trader | Analysis & Trade Ideas
📲 Telegram → t.me/totoshkatradingteam
FxPro → direct.start-fxpro.finance/ru/partner/SwHtc7m3
AMarkets → profit-market.info/promo/?g=BZA6ZC
📲 Telegram → t.me/totoshkatradingteam
FxPro → direct.start-fxpro.finance/ru/partner/SwHtc7m3
AMarkets → profit-market.info/promo/?g=BZA6ZC
Verbundene Veröffentlichungen
Haftungsausschluss
Die Informationen und Veröffentlichungen sind nicht als Finanz-, Anlage-, Handels- oder andere Arten von Ratschlägen oder Empfehlungen gedacht, die von TradingView bereitgestellt oder gebilligt werden, und stellen diese nicht dar. Lesen Sie mehr in den Nutzungsbedingungen.