
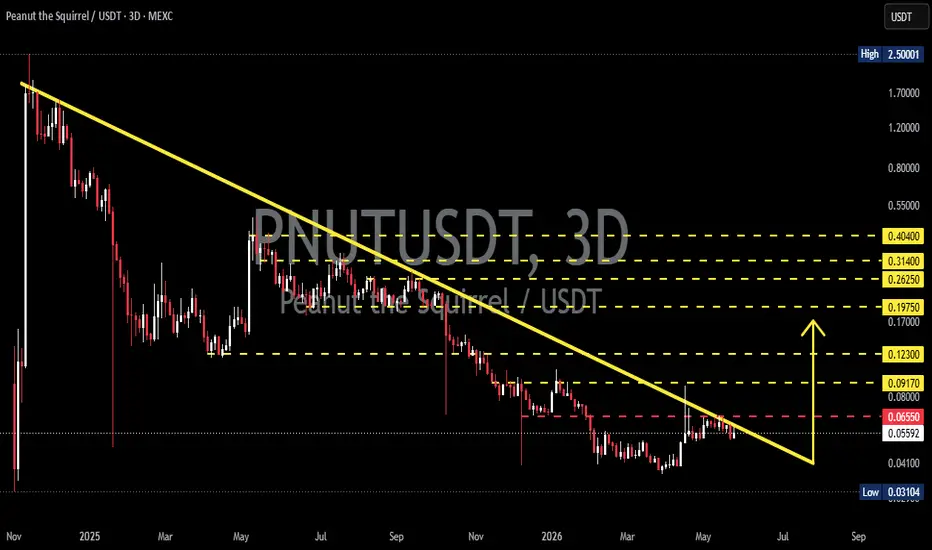
The PNUT/USDT chart on the 3D timeframe is still moving within a major downtrend structure, clearly visible from the Descending TrendLine that has continuously pressured the price since the previous high area. 📊
However, price action is starting to show signs of consolidation at the lower zone and is attempting to approach the main trendline resistance. ⚡
If selling pressure begins to weaken and buying volume increases, this area could potentially become an accumulation phase before a major breakout occurs. 🔥
---
📉 Pattern Analysis — Descending TrendLine
The main pattern on this chart is a Descending TrendLine Resistance, where price continuously forms lower highs while moving downward along the diagonal resistance line. 📐
✨ Characteristics of this pattern:
✅ The main trend is still bearish
✅ Sellers remain dominant while price stays below the trendline
✅ The more often resistance is tested, the weaker it becomes
✅ A valid breakout could trigger a medium-term trend reversal 🚀
Currently, price appears to be compressing near the lower part of the trendline, which is often an early sign before major volatility emerges. ⚠️
---
🟢 Bullish Scenario 🚀
The bullish scenario will activate if PNUT manages to break out and close strongly above the trendline resistance area while reclaiming the nearest horizontal resistance. 📈
🎯 Important bullish levels:
🔹 Initial resistance: 0.06550
🔹 Next resistance: 0.09170
🔹 Next target: 0.12300
🔹 Mid-term target: 0.19750
🔹 Major resistance: 0.26250 — 0.31400
🔹 Extreme bullish target: 0.40400 🚀
If the breakout happens with strong volume, the long-term downtrend structure could potentially shift into a bullish reversal. 🔥
📌 Strong bullish confirmations:
✅ Large breakout candle
✅ Increasing volume
✅ Successful retest of the trendline
✅ Formation of a higher low after breakout
---
🔴 Bearish Scenario 📉
The bearish scenario remains dominant as long as price fails to break out from the Descending TrendLine. ⚠️
❌ Bearish risks to watch:
🔻 Rejection from trendline resistance
🔻 Weakening buy volume
🔻 Breakdown below support areas
🔻 Formation of new lower lows
🛑 Important support areas:
🔸 Minor support: 0.04100
🔸 Major support: 0.03104
If the major support is broken, PNUT could potentially continue its distribution phase and print new lows. 📉
---
📊 Conclusion
PNUT is currently sitting in a critical area as price approaches the end of its long-term Descending TrendLine structure. 📐
The market bias remains bearish, but momentum is beginning to show potential reversal signals if a breakout successfully occurs. 👀🔥
📍 Key areas to monitor:
✔️ Volume reaction
✔️ Trendline breakout
✔️ New support validation
A valid breakout could open the door for a major rally 🚀, while rejection may continue deeper downside pressure 📉
#PNUT #PNUTUSDT #Crypto #TechnicalAnalysis #Altcoin #CryptoTrading #Bullish #Bearish #DescendingTrendline #Breakout #SupportResistance #ChartAnalysis
However, price action is starting to show signs of consolidation at the lower zone and is attempting to approach the main trendline resistance. ⚡
If selling pressure begins to weaken and buying volume increases, this area could potentially become an accumulation phase before a major breakout occurs. 🔥
---
📉 Pattern Analysis — Descending TrendLine
The main pattern on this chart is a Descending TrendLine Resistance, where price continuously forms lower highs while moving downward along the diagonal resistance line. 📐
✨ Characteristics of this pattern:
✅ The main trend is still bearish
✅ Sellers remain dominant while price stays below the trendline
✅ The more often resistance is tested, the weaker it becomes
✅ A valid breakout could trigger a medium-term trend reversal 🚀
Currently, price appears to be compressing near the lower part of the trendline, which is often an early sign before major volatility emerges. ⚠️
---
🟢 Bullish Scenario 🚀
The bullish scenario will activate if PNUT manages to break out and close strongly above the trendline resistance area while reclaiming the nearest horizontal resistance. 📈
🎯 Important bullish levels:
🔹 Initial resistance: 0.06550
🔹 Next resistance: 0.09170
🔹 Next target: 0.12300
🔹 Mid-term target: 0.19750
🔹 Major resistance: 0.26250 — 0.31400
🔹 Extreme bullish target: 0.40400 🚀
If the breakout happens with strong volume, the long-term downtrend structure could potentially shift into a bullish reversal. 🔥
📌 Strong bullish confirmations:
✅ Large breakout candle
✅ Increasing volume
✅ Successful retest of the trendline
✅ Formation of a higher low after breakout
---
🔴 Bearish Scenario 📉
The bearish scenario remains dominant as long as price fails to break out from the Descending TrendLine. ⚠️
❌ Bearish risks to watch:
🔻 Rejection from trendline resistance
🔻 Weakening buy volume
🔻 Breakdown below support areas
🔻 Formation of new lower lows
🛑 Important support areas:
🔸 Minor support: 0.04100
🔸 Major support: 0.03104
If the major support is broken, PNUT could potentially continue its distribution phase and print new lows. 📉
---
📊 Conclusion
PNUT is currently sitting in a critical area as price approaches the end of its long-term Descending TrendLine structure. 📐
The market bias remains bearish, but momentum is beginning to show potential reversal signals if a breakout successfully occurs. 👀🔥
📍 Key areas to monitor:
✔️ Volume reaction
✔️ Trendline breakout
✔️ New support validation
A valid breakout could open the door for a major rally 🚀, while rejection may continue deeper downside pressure 📉
#PNUT #PNUTUSDT #Crypto #TechnicalAnalysis #Altcoin #CryptoTrading #Bullish #Bearish #DescendingTrendline #Breakout #SupportResistance #ChartAnalysis

✅ Get Free Signals! Join Our Telegram Channel Here: t.me/TheCryptoNuclear
✅ Twitter: twitter.com/crypto_nuclear
✅ Join Bybit : partner.bybit.com/b/nuclearvip
✅ Benefits : Lifetime Trading Fee Discount -50%
✅ Twitter: twitter.com/crypto_nuclear
✅ Join Bybit : partner.bybit.com/b/nuclearvip
✅ Benefits : Lifetime Trading Fee Discount -50%
Haftungsausschluss
Die Informationen und Veröffentlichungen sind nicht als Finanz-, Anlage-, Handels- oder andere Arten von Ratschlägen oder Empfehlungen gedacht, die von TradingView bereitgestellt oder gebilligt werden, und stellen diese nicht dar. Lesen Sie mehr in den Nutzungsbedingungen.
✅ Get Free Signals! Join Our Telegram Channel Here: t.me/TheCryptoNuclear
✅ Twitter: twitter.com/crypto_nuclear
✅ Join Bybit : partner.bybit.com/b/nuclearvip
✅ Benefits : Lifetime Trading Fee Discount -50%
✅ Twitter: twitter.com/crypto_nuclear
✅ Join Bybit : partner.bybit.com/b/nuclearvip
✅ Benefits : Lifetime Trading Fee Discount -50%
Haftungsausschluss
Die Informationen und Veröffentlichungen sind nicht als Finanz-, Anlage-, Handels- oder andere Arten von Ratschlägen oder Empfehlungen gedacht, die von TradingView bereitgestellt oder gebilligt werden, und stellen diese nicht dar. Lesen Sie mehr in den Nutzungsbedingungen.