
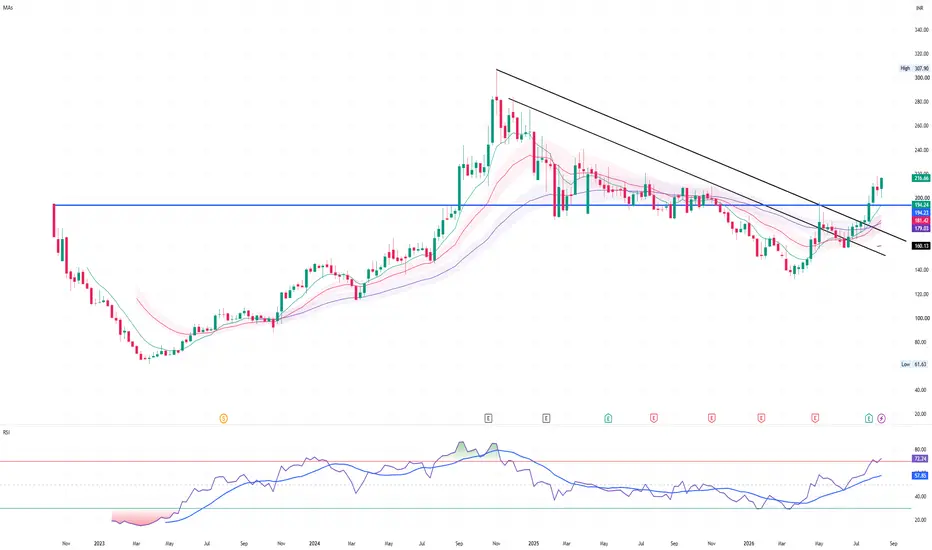
Current price: ₹216.66 | Weekly chart
- Trend: Strong bullish reversal. Price has broken above the long-term falling trendline and the major ₹194 resistance.
- Moving averages: Price is above all shown MAs — ₹194, ₹181, ₹179 — and they are beginning to turn upward. This is a strong trend-improvement signal.
- Breakout: The move above ₹194 is the key event. The breakout is accompanied by a strong candle, making it more credible.
- Momentum: RSI 72.24 — very strong, but now technically overbought. This means momentum is excellent, but chasing at ₹216–220 carries higher short-term pullback risk.
- Immediate resistance: ₹220–225
- Next targets: ₹240–250, then ₹270–280
- Major historical resistance: ₹280–290; above that, the chart opens toward ₹300+.
- Breakout support: ₹194–200. A successful retest of this zone would be particularly attractive.
- Deeper support: ₹179–181.
Best strategy: Don't chase the +20% type move after the breakout. I'd prefer either:
1. ₹200–205 retest + bullish reversal, or
2. A sustained weekly close above ₹220, followed by continuation.
Risk signal: A weekly close back below ₹194 would make the breakout questionable.
My read
This is stronger than a simple bounce. The combination of trendline breakout + ₹194 resistance breakout + price above all major MAs + rising RSI gives PPL Pharma a genuine medium-term bullish setup.
Probability framework from the chart:
🟢 Bullish continuation: ~70%
🟡 Consolidation/pullback: ~25%
🔴 Failed breakout: ~5%
- Trend: Strong bullish reversal. Price has broken above the long-term falling trendline and the major ₹194 resistance.
- Moving averages: Price is above all shown MAs — ₹194, ₹181, ₹179 — and they are beginning to turn upward. This is a strong trend-improvement signal.
- Breakout: The move above ₹194 is the key event. The breakout is accompanied by a strong candle, making it more credible.
- Momentum: RSI 72.24 — very strong, but now technically overbought. This means momentum is excellent, but chasing at ₹216–220 carries higher short-term pullback risk.
- Immediate resistance: ₹220–225
- Next targets: ₹240–250, then ₹270–280
- Major historical resistance: ₹280–290; above that, the chart opens toward ₹300+.
- Breakout support: ₹194–200. A successful retest of this zone would be particularly attractive.
- Deeper support: ₹179–181.
Best strategy: Don't chase the +20% type move after the breakout. I'd prefer either:
1. ₹200–205 retest + bullish reversal, or
2. A sustained weekly close above ₹220, followed by continuation.
Risk signal: A weekly close back below ₹194 would make the breakout questionable.
My read
This is stronger than a simple bounce. The combination of trendline breakout + ₹194 resistance breakout + price above all major MAs + rising RSI gives PPL Pharma a genuine medium-term bullish setup.
Probability framework from the chart:
🟢 Bullish continuation: ~70%
🟡 Consolidation/pullback: ~25%
🔴 Failed breakout: ~5%

Haftungsausschluss
Die Informationen und Veröffentlichungen sind nicht als Finanz-, Anlage-, Handels- oder andere Arten von Ratschlägen oder Empfehlungen gedacht, die von TradingView bereitgestellt oder gebilligt werden, und stellen diese nicht dar. Lesen Sie mehr in den Nutzungsbedingungen.
Haftungsausschluss
Die Informationen und Veröffentlichungen sind nicht als Finanz-, Anlage-, Handels- oder andere Arten von Ratschlägen oder Empfehlungen gedacht, die von TradingView bereitgestellt oder gebilligt werden, und stellen diese nicht dar. Lesen Sie mehr in den Nutzungsbedingungen.