Long
RDN/USDT 1D Update
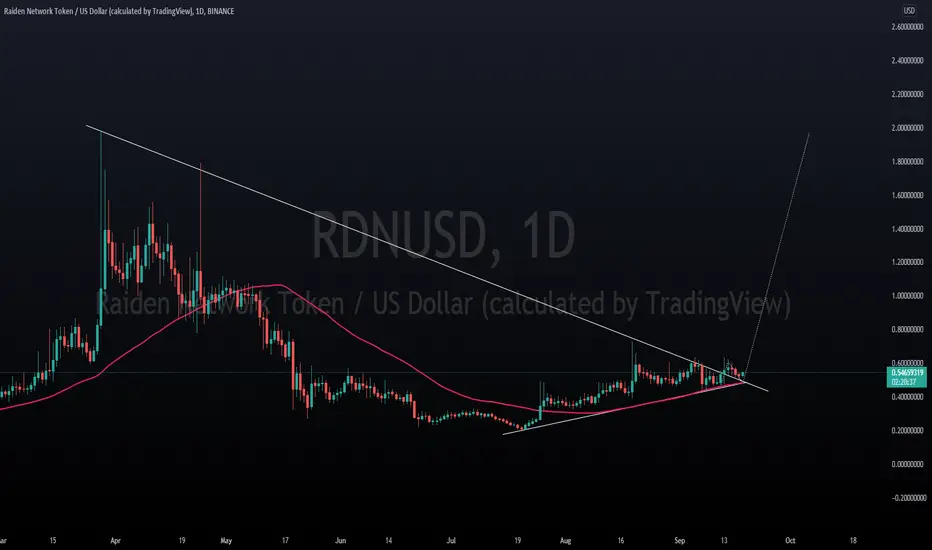
RDN broke out of the 168 days resistance trendline.
This is a daily chart so it's highly likely we will see a good rally here.
It is currently retesting the resistance turned support.
Also trading above both 50D and 21D MA.
Accumulation Range:- 980 sats to 1150 sats
Targets:-
1465
1692
1858
2401
Stop loss:- 841
Rembebar.This is not a piece of financial advice. All investment made by me is under my own risk and I am held responsible for my own profit and losses. So, do your own research before investing in this trade..
Happy trading...
Thank you...
This is a daily chart so it's highly likely we will see a good rally here.
It is currently retesting the resistance turned support.
Also trading above both 50D and 21D MA.
Accumulation Range:- 980 sats to 1150 sats
Targets:-
1465
1692
1858
2401
Stop loss:- 841
Rembebar.This is not a piece of financial advice. All investment made by me is under my own risk and I am held responsible for my own profit and losses. So, do your own research before investing in this trade..
Happy trading...
Thank you...

Haftungsausschluss
Die Informationen und Veröffentlichungen sind nicht als Finanz-, Anlage-, Handels- oder andere Arten von Ratschlägen oder Empfehlungen gedacht, die von TradingView bereitgestellt oder gebilligt werden, und stellen diese nicht dar. Lesen Sie mehr in den Nutzungsbedingungen.
Haftungsausschluss
Die Informationen und Veröffentlichungen sind nicht als Finanz-, Anlage-, Handels- oder andere Arten von Ratschlägen oder Empfehlungen gedacht, die von TradingView bereitgestellt oder gebilligt werden, und stellen diese nicht dar. Lesen Sie mehr in den Nutzungsbedingungen.