
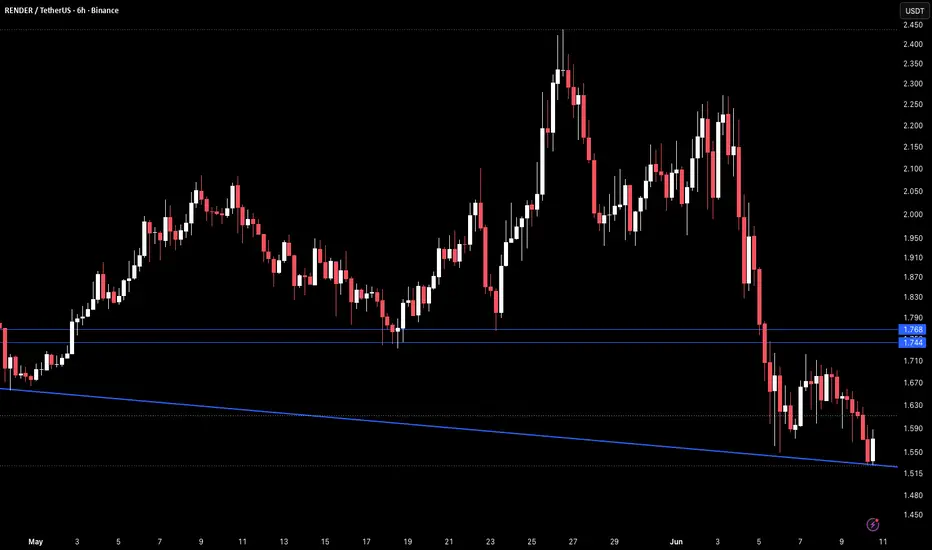
RENDER on the 6H timeframe is currently trading around 1.577 after a sharp sell-off in early June that broke through the rising macro trendline from the February lows and two key horizontal support levels at 1.744 and 1.768 in quick succession, pushing price to the lowest level on this chart.
The trendline that had been the macro floor for over three months was broken cleanly with no meaningful recovery, and both horizontal levels that had acted as consistent pivots throughout April and May are now overhead resistance.
There is no visible structural support below current levels on this chart.
Key Levels To Watch
2.400–2.450 → Prior spike high, major resistance above
2.100–2.200 → Prior range highs, key resistance
1.900–1.950 → Prior support zone, now resistance
1.768 → First broken horizontal support, now resistance
1.744 → Second broken horizontal support, now resistance
1.577 → Current price, lowest level on chart
Below 1.515 → No visible support, new lows likely
The structure is fully bearish. The rising macro trendline that had survived multiple deep tests across three months was broken decisively and both horizontal support levels that defined the range floor have now been lost.
A recovery back above 1.744 and a hold above 1.768 would be the minimum requirement for any structural shift, putting the broken trendline overhead as the next resistance.
Continued rejection below 1.744 keeps the path of least resistance toward 1.515 and potentially new lows below.
Structure fully bearish below broken trendline and horizontal support.
Recovery only on reclaim of 1.744–1.768.
Below 1.515 opens room toward new lows with no structure below.
The trendline that had been the macro floor for over three months was broken cleanly with no meaningful recovery, and both horizontal levels that had acted as consistent pivots throughout April and May are now overhead resistance.
There is no visible structural support below current levels on this chart.
Key Levels To Watch
2.400–2.450 → Prior spike high, major resistance above
2.100–2.200 → Prior range highs, key resistance
1.900–1.950 → Prior support zone, now resistance
1.768 → First broken horizontal support, now resistance
1.744 → Second broken horizontal support, now resistance
1.577 → Current price, lowest level on chart
Below 1.515 → No visible support, new lows likely
The structure is fully bearish. The rising macro trendline that had survived multiple deep tests across three months was broken decisively and both horizontal support levels that defined the range floor have now been lost.
A recovery back above 1.744 and a hold above 1.768 would be the minimum requirement for any structural shift, putting the broken trendline overhead as the next resistance.
Continued rejection below 1.744 keeps the path of least resistance toward 1.515 and potentially new lows below.
Structure fully bearish below broken trendline and horizontal support.
Recovery only on reclaim of 1.744–1.768.
Below 1.515 opens room toward new lows with no structure below.

Haftungsausschluss
Die Informationen und Veröffentlichungen sind nicht als Finanz-, Anlage-, Handels- oder andere Arten von Ratschlägen oder Empfehlungen gedacht, die von TradingView bereitgestellt oder gebilligt werden, und stellen diese nicht dar. Lesen Sie mehr in den Nutzungsbedingungen.
Haftungsausschluss
Die Informationen und Veröffentlichungen sind nicht als Finanz-, Anlage-, Handels- oder andere Arten von Ratschlägen oder Empfehlungen gedacht, die von TradingView bereitgestellt oder gebilligt werden, und stellen diese nicht dar. Lesen Sie mehr in den Nutzungsbedingungen.