
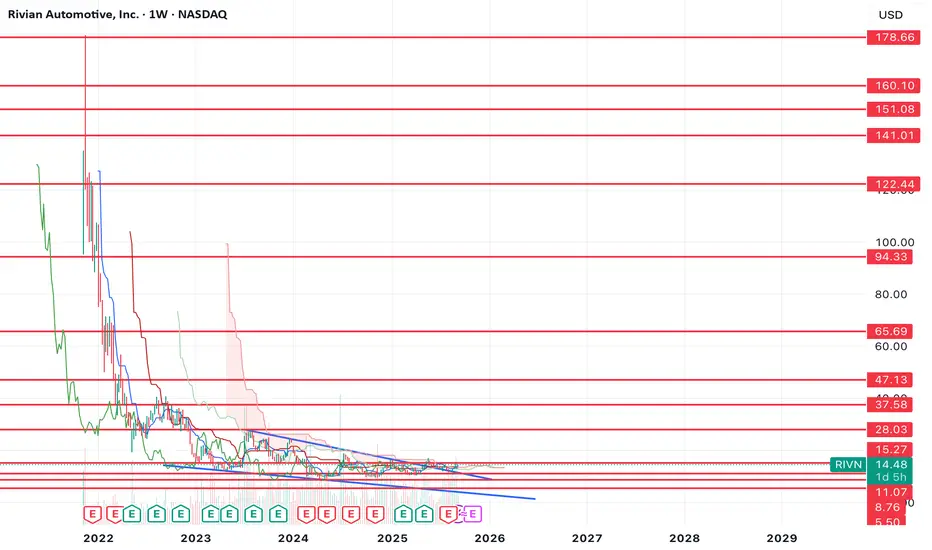
The RIVN chart is starting to look good here. As you can see from the chart, we've broken out of a falling wedge. The next challenge is for price to flip the $15.27 resistance level as support and retest it.
If it can do that, then I think we can start to see a sustained uptrend. If it tests $15.27 or briefly breaks above it and rejects, then I think there's a possibility of one more retest of the lows prior to the move starting.
That said, the chart is starting to look really good over the long term. I think this has 10X+ potential over the coming years.
If it can do that, then I think we can start to see a sustained uptrend. If it tests $15.27 or briefly breaks above it and rejects, then I think there's a possibility of one more retest of the lows prior to the move starting.
That said, the chart is starting to look really good over the long term. I think this has 10X+ potential over the coming years.

Haftungsausschluss
Die Informationen und Veröffentlichungen sind nicht als Finanz-, Anlage-, Handels- oder andere Arten von Ratschlägen oder Empfehlungen gedacht, die von TradingView bereitgestellt oder gebilligt werden, und stellen diese nicht dar. Lesen Sie mehr in den Nutzungsbedingungen.
Haftungsausschluss
Die Informationen und Veröffentlichungen sind nicht als Finanz-, Anlage-, Handels- oder andere Arten von Ratschlägen oder Empfehlungen gedacht, die von TradingView bereitgestellt oder gebilligt werden, und stellen diese nicht dar. Lesen Sie mehr in den Nutzungsbedingungen.