
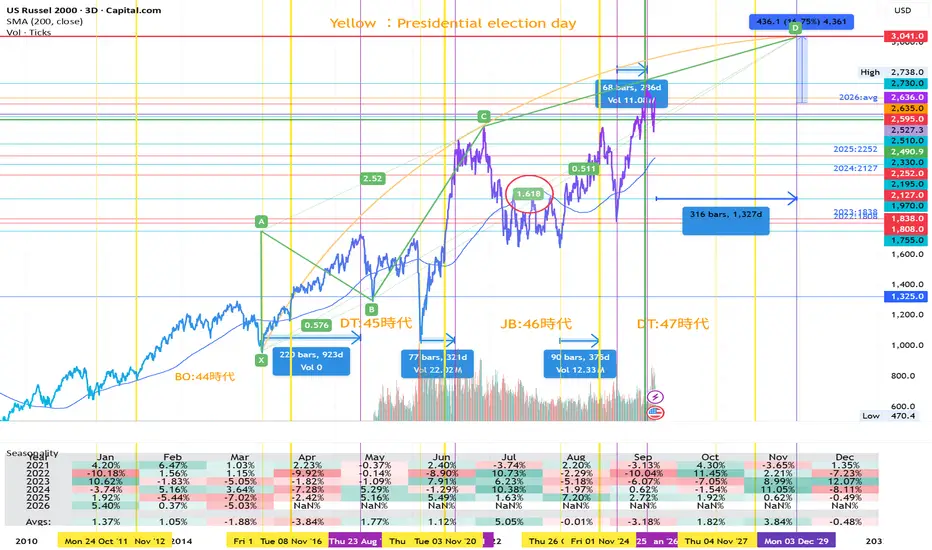
This is a continuation of the previous chart analysis. It’s a long journey—almost like a field trip.
The Russell 2000 Index is currently at a year-to-date level of +6.53%.
Now then, according to geometric delta analysis, with a remaining time of approximately 1,327 days, the level along the trajectory defined by the golden ratio (1.618) is 3,041 points.
This reflects the typical relationship between U.S. presidential election timing and equity market behavior. Given that the Russell 2000 consists of small- and mid-cap stocks, it tends to enter an upward trend roughly one year prior to a U.S. presidential election.
Yellow :Presidential election day
The Russell 2000 Index is currently at a year-to-date level of +6.53%.
Now then, according to geometric delta analysis, with a remaining time of approximately 1,327 days, the level along the trajectory defined by the golden ratio (1.618) is 3,041 points.
This reflects the typical relationship between U.S. presidential election timing and equity market behavior. Given that the Russell 2000 consists of small- and mid-cap stocks, it tends to enter an upward trend roughly one year prior to a U.S. presidential election.
Yellow :Presidential election day

Verbundene Veröffentlichungen
Haftungsausschluss
Die Informationen und Veröffentlichungen sind nicht als Finanz-, Anlage-, Handels- oder andere Arten von Ratschlägen oder Empfehlungen gedacht, die von TradingView bereitgestellt oder gebilligt werden, und stellen diese nicht dar. Lesen Sie mehr in den Nutzungsbedingungen.
Verbundene Veröffentlichungen
Haftungsausschluss
Die Informationen und Veröffentlichungen sind nicht als Finanz-, Anlage-, Handels- oder andere Arten von Ratschlägen oder Empfehlungen gedacht, die von TradingView bereitgestellt oder gebilligt werden, und stellen diese nicht dar. Lesen Sie mehr in den Nutzungsbedingungen.