
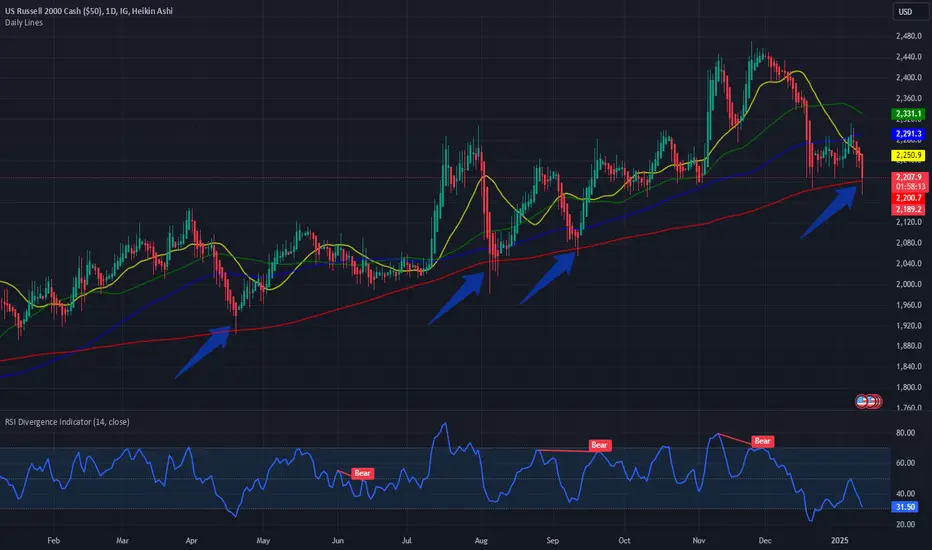
#TGIF. A simple chart to end the week. The US Small Cap index Russel 2000 its just hovering above its 200 Day SMA on the daily chart. Every time this happened in the last 1 year it was a bullish indicator in a medium term. The 50- and 100-Day SMA are below the 20 Day SMA which is a short term bearish indicator.

Haftungsausschluss
Die Informationen und Veröffentlichungen sind nicht als Finanz-, Anlage-, Handels- oder andere Arten von Ratschlägen oder Empfehlungen gedacht, die von TradingView bereitgestellt oder gebilligt werden, und stellen diese nicht dar. Lesen Sie mehr in den Nutzungsbedingungen.
Haftungsausschluss
Die Informationen und Veröffentlichungen sind nicht als Finanz-, Anlage-, Handels- oder andere Arten von Ratschlägen oder Empfehlungen gedacht, die von TradingView bereitgestellt oder gebilligt werden, und stellen diese nicht dar. Lesen Sie mehr in den Nutzungsbedingungen.