
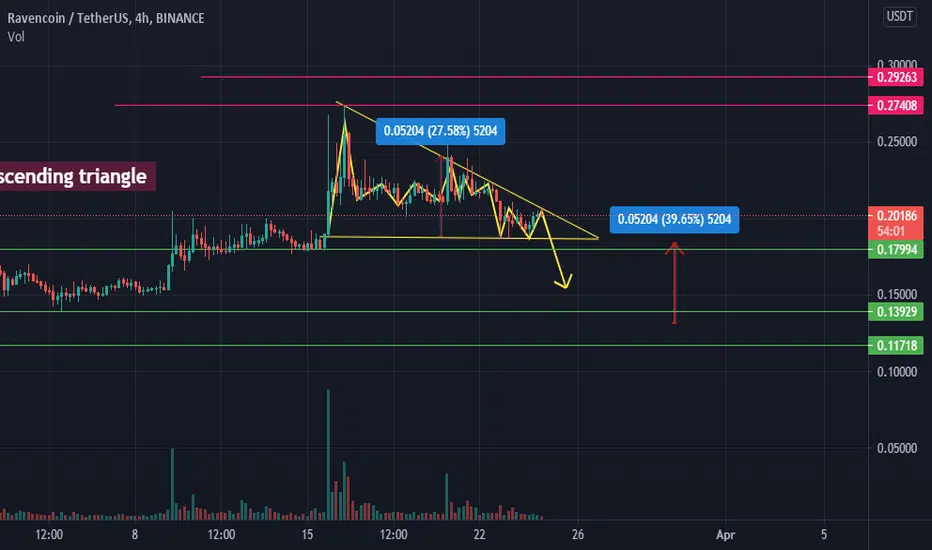
We can see a descending triangle on 4 hour chart of RVN/USDT (Binance).
DESCENDING TRIANGLE has bearish reversal interpretation.
If it breaks it support line it will breakdown to the marked point.
Red lines represents major resistances while green are showing major supports.
We can clearly see 2 valid taps on resistance line and support line inside the formed triangle.
Dial indicator showing ( Bought indicator ) means that the current volume is at sell signal.
DESCENDING TRIANGLE has bearish reversal interpretation.
If it breaks it support line it will breakdown to the marked point.
Red lines represents major resistances while green are showing major supports.
We can clearly see 2 valid taps on resistance line and support line inside the formed triangle.
Dial indicator showing ( Bought indicator ) means that the current volume is at sell signal.

Haftungsausschluss
Die Informationen und Veröffentlichungen sind nicht als Finanz-, Anlage-, Handels- oder andere Arten von Ratschlägen oder Empfehlungen gedacht, die von TradingView bereitgestellt oder gebilligt werden, und stellen diese nicht dar. Lesen Sie mehr in den Nutzungsbedingungen.
Haftungsausschluss
Die Informationen und Veröffentlichungen sind nicht als Finanz-, Anlage-, Handels- oder andere Arten von Ratschlägen oder Empfehlungen gedacht, die von TradingView bereitgestellt oder gebilligt werden, und stellen diese nicht dar. Lesen Sie mehr in den Nutzungsbedingungen.