
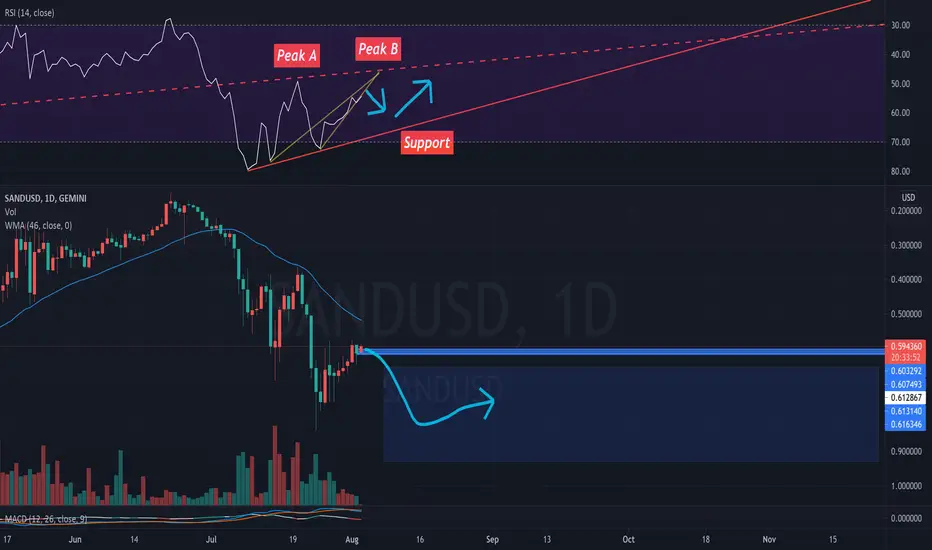
!!!INVERTED CHART !!!
Bullish on Sand for now
You can see that on the RSI- Peak B is very weak compared to previous Peak A.
That tells me Peak B wont reach the dash resistance line much less break it.
So I placed sell orders along the bullish blue path because I expect Peak B to bounce towards 60-70 on the RSI to the support.
Once that happens it will gain strength to test the dash resistance again which will turn bearish then...
Bullish on Sand for now
You can see that on the RSI- Peak B is very weak compared to previous Peak A.
That tells me Peak B wont reach the dash resistance line much less break it.
So I placed sell orders along the bullish blue path because I expect Peak B to bounce towards 60-70 on the RSI to the support.
Once that happens it will gain strength to test the dash resistance again which will turn bearish then...

Haftungsausschluss
Die Informationen und Veröffentlichungen sind nicht als Finanz-, Anlage-, Handels- oder andere Arten von Ratschlägen oder Empfehlungen gedacht, die von TradingView bereitgestellt oder gebilligt werden, und stellen diese nicht dar. Lesen Sie mehr in den Nutzungsbedingungen.
Haftungsausschluss
Die Informationen und Veröffentlichungen sind nicht als Finanz-, Anlage-, Handels- oder andere Arten von Ratschlägen oder Empfehlungen gedacht, die von TradingView bereitgestellt oder gebilligt werden, und stellen diese nicht dar. Lesen Sie mehr in den Nutzungsbedingungen.