
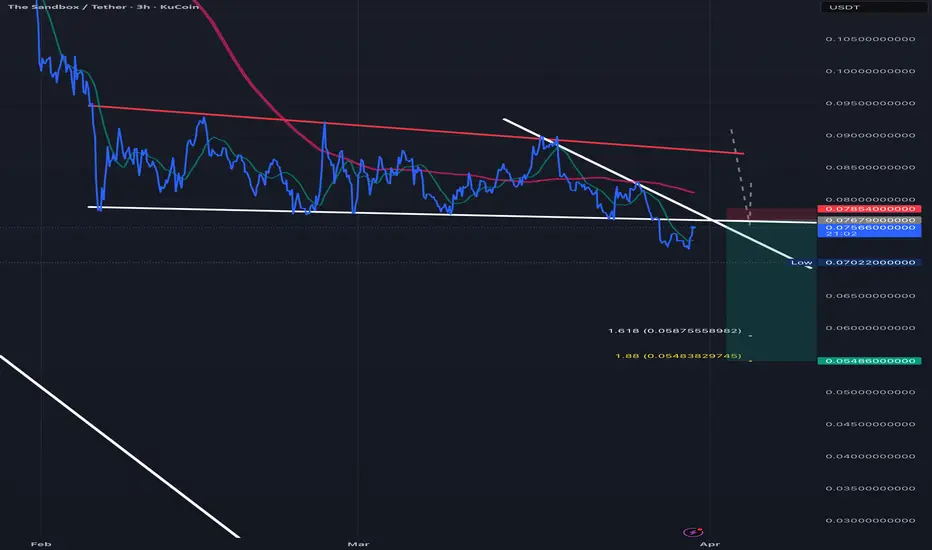
1. The Setup: "The Squeeze"
Imagine the price is bouncing between a **slanted ceiling** (the red line) and a **flat floor** (the white line).
* The ceiling is pushing the price down lower and lower.
* The floor is holding it up.
* Eventually, the space runs out, and the price has to "burst" through one of them.
### 2. The Move: "The Breakdown"
In your chart, the price just **fell through the floor**. This is the signal to sell (or "Short").
* Once a floor breaks, it usually becomes the new ceiling.
* The fact that the price is staying below that white line suggests the "break" is real.
### 3. The Plan (Your Strategy)
You are essentially betting that since the floor broke, the price will gravity-drop to the next level.
* **Entry:** You enter right after the floor breaks ($0.0755).
* **Stop Loss (The Emergency Brake):** You set a limit at **$0.0785**. If the price jumps back *above* the floor, the trade is "broken," and you get out to protect your money.
* **Take Profit (The Goal):** You are aiming for **$0.0548**. This is based on the height of the triangle—basically, the "energy" the move had before it broke.
### 4. Summary
* **Pattern:** Descending Triangle (Bearish).
* **Signal:** Candle closing below the white support line.
* **Goal:** Catch the drop to the Fibonacci targets

Haftungsausschluss
Die Informationen und Veröffentlichungen sind nicht als Finanz-, Anlage-, Handels- oder andere Arten von Ratschlägen oder Empfehlungen gedacht, die von TradingView bereitgestellt oder gebilligt werden, und stellen diese nicht dar. Lesen Sie mehr in den Nutzungsbedingungen.
Haftungsausschluss
Die Informationen und Veröffentlichungen sind nicht als Finanz-, Anlage-, Handels- oder andere Arten von Ratschlägen oder Empfehlungen gedacht, die von TradingView bereitgestellt oder gebilligt werden, und stellen diese nicht dar. Lesen Sie mehr in den Nutzungsbedingungen.