
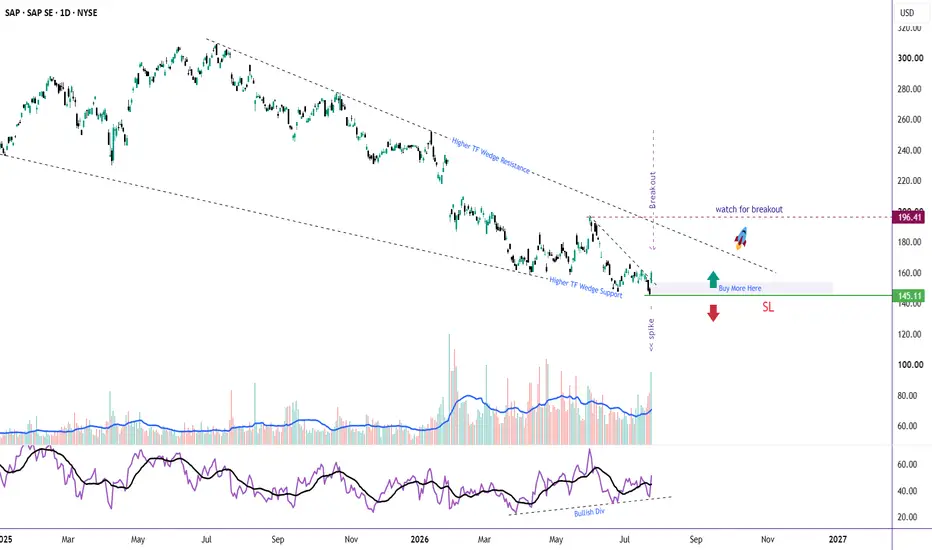
SAP delivered strong earnings, and the market responded with conviction. The stock surged on exceptionally high volume, breaking out of its short-term downtrend—a sign that institutional buyers may be stepping back in.
But there's a bigger story unfolding.
📊 The Story
After almot a year of correcting within a higher-timeframe falling wedge, SAP has finally shown its first meaningful sign of strength.
The recent breakout came with:
🟢 A strong volume spike, adding credibility to the move.
🟢 Bullish RSI divergence, suggesting bearish momentum had already been fading before price turned higher.
🟢 A breakout from the short-term descending trendline, potentially marking the end of the recent corrective phase.
However, the stock is still trading inside the larger falling wedge, meaning the real confirmation is yet to come.
🎯 Bullish Scenario
If buyers continue to defend the breakout, the next logical upside targets are:
🎯 $180 – Initial resistance
🎯 $195 – Major resistance and upper target
A decisive breakout above the higher-timeframe wedge resistance could signal the beginning of a much stronger bullish trend, opening the door for even higher prices.
👀 What I'm Watching
The recent earnings-driven move is encouraging, but I want to see follow-through.
A successful retest of the breakout zone followed by a breakout from the higher-timeframe wedge would significantly strengthen the bullish case.
Until then, this remains an attractive setup developing within a larger structure.
❌ Invalidation
The bullish thesis remains valid as long as SAP holds above $145 on a daily closing basis.
A decisive daily close below $145 would invalidate this setup and suggest the correction is not over yet.
📖 Conclusion:
SAP is transitioning from accumulation to potential trend reversal. The volume breakout and bullish divergence have shifted the odds in favor of the bulls—but the higher-timeframe wedge breakout is the catalyst that could turn a good setup into a great one. 🚀
But there's a bigger story unfolding.
📊 The Story
After almot a year of correcting within a higher-timeframe falling wedge, SAP has finally shown its first meaningful sign of strength.
The recent breakout came with:
🟢 A strong volume spike, adding credibility to the move.
🟢 Bullish RSI divergence, suggesting bearish momentum had already been fading before price turned higher.
🟢 A breakout from the short-term descending trendline, potentially marking the end of the recent corrective phase.
However, the stock is still trading inside the larger falling wedge, meaning the real confirmation is yet to come.
🎯 Bullish Scenario
If buyers continue to defend the breakout, the next logical upside targets are:
🎯 $180 – Initial resistance
🎯 $195 – Major resistance and upper target
A decisive breakout above the higher-timeframe wedge resistance could signal the beginning of a much stronger bullish trend, opening the door for even higher prices.
👀 What I'm Watching
The recent earnings-driven move is encouraging, but I want to see follow-through.
A successful retest of the breakout zone followed by a breakout from the higher-timeframe wedge would significantly strengthen the bullish case.
Until then, this remains an attractive setup developing within a larger structure.
❌ Invalidation
The bullish thesis remains valid as long as SAP holds above $145 on a daily closing basis.
A decisive daily close below $145 would invalidate this setup and suggest the correction is not over yet.
📖 Conclusion:
SAP is transitioning from accumulation to potential trend reversal. The volume breakout and bullish divergence have shifted the odds in favor of the bulls—but the higher-timeframe wedge breakout is the catalyst that could turn a good setup into a great one. 🚀
Trade ist aktiv
Moving as expected.Anmerkung
hits TP1 aka first resistance at 180.Anmerkung
SAP heading towards TP2, strong zone ahead. watch for breakout above 195Anmerkung
here we are, the moment of truth. breaking above 195 will unlock new rallies.
📊 Charts → 🏗️ Structure → 🎯 Probability =📖 Chart Story
⏳ Patience → 🚀Success
🎯 If this setup makes sense to you, show it some support with a Boost.
⏳ Patience → 🚀Success
🎯 If this setup makes sense to you, show it some support with a Boost.
Haftungsausschluss
Die Informationen und Veröffentlichungen sind nicht als Finanz-, Anlage-, Handels- oder andere Arten von Ratschlägen oder Empfehlungen gedacht, die von TradingView bereitgestellt oder gebilligt werden, und stellen diese nicht dar. Lesen Sie mehr in den Nutzungsbedingungen.
📊 Charts → 🏗️ Structure → 🎯 Probability =📖 Chart Story
⏳ Patience → 🚀Success
🎯 If this setup makes sense to you, show it some support with a Boost.
⏳ Patience → 🚀Success
🎯 If this setup makes sense to you, show it some support with a Boost.
Haftungsausschluss
Die Informationen und Veröffentlichungen sind nicht als Finanz-, Anlage-, Handels- oder andere Arten von Ratschlägen oder Empfehlungen gedacht, die von TradingView bereitgestellt oder gebilligt werden, und stellen diese nicht dar. Lesen Sie mehr in den Nutzungsbedingungen.