Long
SAVMUSDT: Consolidation Breakout on the Horizon?
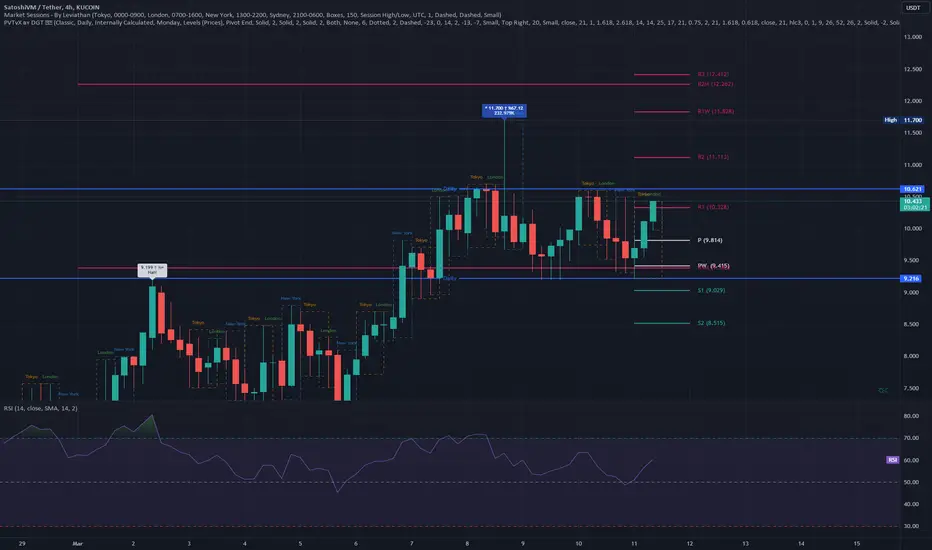
The SAVMUSDT chart is currently exhibiting signs of a potential bullish breakout. While the price is currently within a consolidation zone, several technical indicators suggest an upward move might be imminent.
Key factors to consider:
This analysis is for informational purposes only and should not be considered financial advice. Always conduct your own research before making any trading decisions.
Key factors to consider:
- Pivot Points: Both the weekly and daily pivot points are situated below the current price, indicating potential buying pressure.
- RSI: The Relative Strength Index (RSI) is also supportive of a bullish move, suggesting that the asset is not yet overbought.
- Daily Resistance: A decisive close above the daily resistance level could be a strong confirmation of a bullish trend.
This analysis is for informational purposes only and should not be considered financial advice. Always conduct your own research before making any trading decisions.

Haftungsausschluss
Die Informationen und Veröffentlichungen sind nicht als Finanz-, Anlage-, Handels- oder andere Arten von Ratschlägen oder Empfehlungen gedacht, die von TradingView bereitgestellt oder gebilligt werden, und stellen diese nicht dar. Lesen Sie mehr in den Nutzungsbedingungen.
Haftungsausschluss
Die Informationen und Veröffentlichungen sind nicht als Finanz-, Anlage-, Handels- oder andere Arten von Ratschlägen oder Empfehlungen gedacht, die von TradingView bereitgestellt oder gebilligt werden, und stellen diese nicht dar. Lesen Sie mehr in den Nutzungsbedingungen.