
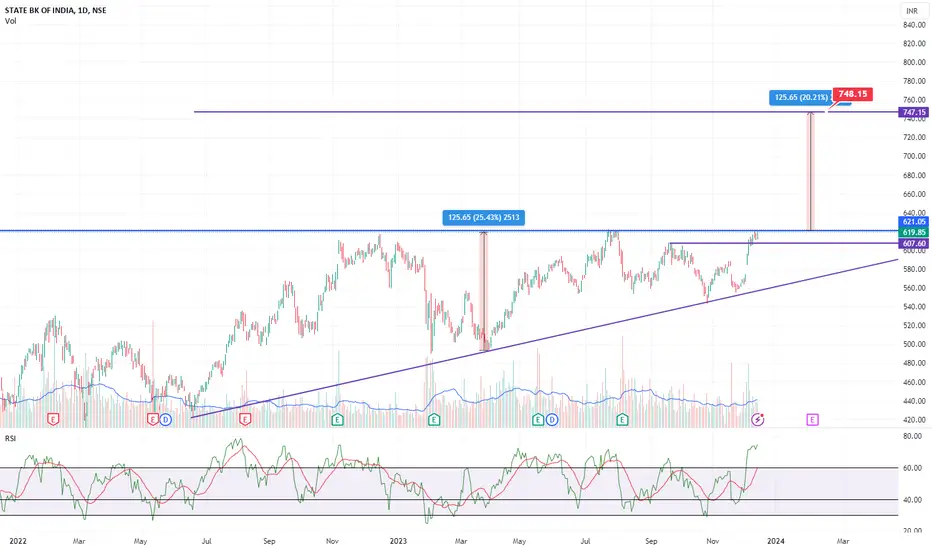
SBI form triangle pattern on weekly chart. If break and sustain above 620 weekly. It may test700-750 in next 2-3 months.
Trade ist aktiv
ActiveTrade ist aktiv
ActiveTrade ist aktiv
Now all loose hand out from stock and strong hands riding towards 740. It will go festered towards target now.So stay hold
Trade geschlossen: Ziel wurde erreicht
SBI target done 740+Enjoy the bumper profit.

Haftungsausschluss
Die Informationen und Veröffentlichungen sind nicht als Finanz-, Anlage-, Handels- oder andere Arten von Ratschlägen oder Empfehlungen gedacht, die von TradingView bereitgestellt oder gebilligt werden, und stellen diese nicht dar. Lesen Sie mehr in den Nutzungsbedingungen.
Haftungsausschluss
Die Informationen und Veröffentlichungen sind nicht als Finanz-, Anlage-, Handels- oder andere Arten von Ratschlägen oder Empfehlungen gedacht, die von TradingView bereitgestellt oder gebilligt werden, und stellen diese nicht dar. Lesen Sie mehr in den Nutzungsbedingungen.