
Chapter 9 — Reading the Market Moment Through Live Execution Intelligence
(A SENSEX Case Study — Observation → Permission → Post-Entry Reality)
1. Why This Chart Matters (Start With Reality, Not Theory)
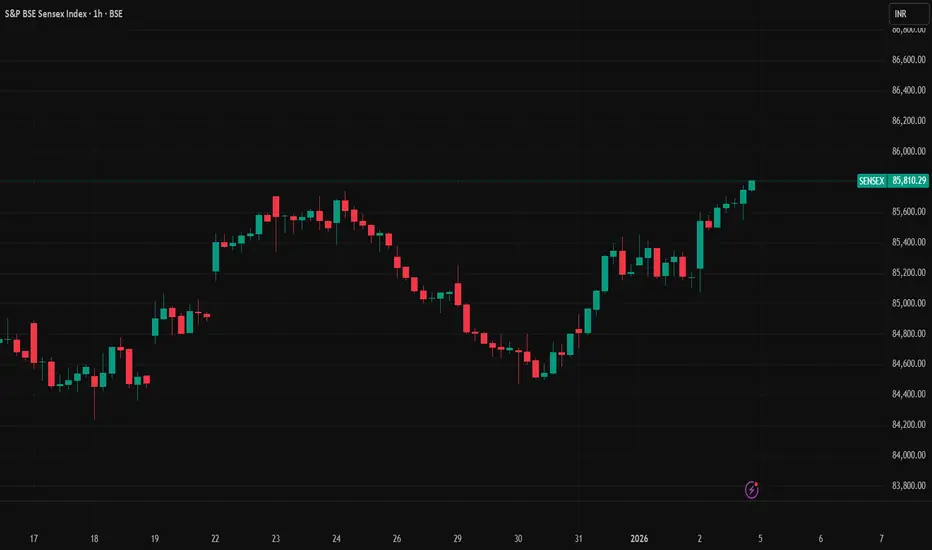
This SENSEX 1H chart is a textbook example of how markets reward disciplined execution and punish emotional continuation.
Price is bullish.
Trend strength is present.
Context alignment is strong.
Yet — not every candle here was tradable.
This is exactly where most traders fail.

(Maral execution trading view live chart attached)
2. Market Moment vs MARAL Moment (Seen on This Chart)
On this chart:
Direction: Bullish
HTF Context: Aligned
Liquidity: High
Participation: Strong
Alignment Score: 93
ADX: Above 30
➡️ This confirms a Market Moment.
But MARAL does not assume permission automatically.
MARAL checks:
Is the move healthy now?
Is continuation supported now?
Is risk expanding now?
This distinction protects traders from late or emotional entries.
3. The Critical Zone: Where Traders Usually Make Mistakes
Observe the mid-chart consolidation and pullback zone.
This is where most traders:
Add aggressively because trend is bullish
Refuse to exit because bias is strong
Ignore internal stress building
Miss early momentum fatigue
Price did not collapse —
but risk quality temporarily degraded.
This is invisible to price-only traders.
4. ECI in Action: Execution Confidence, Not Signal
On this chart:
ECI Score: 93 (A++)
But ECI trend and state matter more than the number
ECI here is used to:
Validate holding, not chasing
Prevent panic during controlled pullbacks
Avoid re-entries during execution stress
ECI does not push trades.
It regulates behavior after entry.
5. Post-Entry Stress: What MARAL Reveals Live
During the pullback phase:
Market Phase: Range
Momentum Health: Neutral
Exit Pressure: Low
Risk State: Overextended
This combination tells a clear story:
Trend intact
But continuation quality temporarily weak
MARAL warns traders:
“Hold is allowed — aggression is not.”
This single insight saves traders from:
Over-adding
Emotional exits
Premature leverage
6. Divergence Risk Modifier: Silent Protection
Even while price structure remained bullish:
Momentum did not expand aggressively
Speed slowed
Energy recycled
This is where divergence risk does not mean reversal,
but means patience is required.
MARAL helps traders:
Avoid adding at exhaustion
Tighten management mentally
Wait for participation to return
7. Participation Strength: The Green Light for Continuation
Notice the right side of the chart:
Participation: STRONG
Liquidity Context: HIGH
Momentum: BULL
Alignment: ACTIVE
This is where MARAL confirms:
Holding remains logical
Trend continuation is supported
Stress has reduced
The rally that follows is earned, not chased.
8. The Key Insight for Real Traders
A trader may already have:
Their own entry setup
Their own trigger
Their own strategy
MARAL does not replace that.
Once the trade is live, MARAL answers:
Is my trade still healthy?
Is risk increasing or stabilizing?
Should I hold, reduce, or stay neutral?
This transforms trading from hope-based holding
to information-based decision-making.
9. Chapter 9 Summary — The Execution Truth
Markets move even when conditions weaken
Strong trends still contain high-risk zones
Most losses happen after entry
Observation must continue after execution
Holding is a decision — not an assumption
MARAL does not tell traders when to enter.
It helps traders understand what is happening now — and respond correctly.
The edge is not predicting the move.
The edge is staying aligned while the market reveals itself.
Educational Disclaimer
This analysis is for educational purposes only.
It does not provide financial advice or trade signals.
Trading involves risk. All decisions remain the trader’s responsibility.
Chapter 10 — Exit Intelligence & Trade Aging (Next chapter coming soon)
Just tell me if you have any clarification.
#TradingEducation
#MarketStructure
#ExecutionDiscipline
#RiskManagement
#TradeManagement
#MarketObservation
#ExecutionIntelligence
#TradingPsychology
#InstitutionalTrading
#PriceAction
#Liquidity
#TrendAnalysis
#CapitalProtection
#Consistency
#TradingView
(A SENSEX Case Study — Observation → Permission → Post-Entry Reality)
1. Why This Chart Matters (Start With Reality, Not Theory)
This SENSEX 1H chart is a textbook example of how markets reward disciplined execution and punish emotional continuation.
Price is bullish.
Trend strength is present.
Context alignment is strong.
Yet — not every candle here was tradable.
This is exactly where most traders fail.
(Maral execution trading view live chart attached)
2. Market Moment vs MARAL Moment (Seen on This Chart)
On this chart:
Direction: Bullish
HTF Context: Aligned
Liquidity: High
Participation: Strong
Alignment Score: 93
ADX: Above 30
➡️ This confirms a Market Moment.
But MARAL does not assume permission automatically.
MARAL checks:
Is the move healthy now?
Is continuation supported now?
Is risk expanding now?
This distinction protects traders from late or emotional entries.
3. The Critical Zone: Where Traders Usually Make Mistakes
Observe the mid-chart consolidation and pullback zone.
This is where most traders:
Add aggressively because trend is bullish
Refuse to exit because bias is strong
Ignore internal stress building
Miss early momentum fatigue
Price did not collapse —
but risk quality temporarily degraded.
This is invisible to price-only traders.
4. ECI in Action: Execution Confidence, Not Signal
On this chart:
ECI Score: 93 (A++)
But ECI trend and state matter more than the number
ECI here is used to:
Validate holding, not chasing
Prevent panic during controlled pullbacks
Avoid re-entries during execution stress
ECI does not push trades.
It regulates behavior after entry.
5. Post-Entry Stress: What MARAL Reveals Live
During the pullback phase:
Market Phase: Range
Momentum Health: Neutral
Exit Pressure: Low
Risk State: Overextended
This combination tells a clear story:
Trend intact
But continuation quality temporarily weak
MARAL warns traders:
“Hold is allowed — aggression is not.”
This single insight saves traders from:
Over-adding
Emotional exits
Premature leverage
6. Divergence Risk Modifier: Silent Protection
Even while price structure remained bullish:
Momentum did not expand aggressively
Speed slowed
Energy recycled
This is where divergence risk does not mean reversal,
but means patience is required.
MARAL helps traders:
Avoid adding at exhaustion
Tighten management mentally
Wait for participation to return
7. Participation Strength: The Green Light for Continuation
Notice the right side of the chart:
Participation: STRONG
Liquidity Context: HIGH
Momentum: BULL
Alignment: ACTIVE
This is where MARAL confirms:
Holding remains logical
Trend continuation is supported
Stress has reduced
The rally that follows is earned, not chased.
8. The Key Insight for Real Traders
A trader may already have:
Their own entry setup
Their own trigger
Their own strategy
MARAL does not replace that.
Once the trade is live, MARAL answers:
Is my trade still healthy?
Is risk increasing or stabilizing?
Should I hold, reduce, or stay neutral?
This transforms trading from hope-based holding
to information-based decision-making.
9. Chapter 9 Summary — The Execution Truth
Markets move even when conditions weaken
Strong trends still contain high-risk zones
Most losses happen after entry
Observation must continue after execution
Holding is a decision — not an assumption
MARAL does not tell traders when to enter.
It helps traders understand what is happening now — and respond correctly.
The edge is not predicting the move.
The edge is staying aligned while the market reveals itself.
Educational Disclaimer
This analysis is for educational purposes only.
It does not provide financial advice or trade signals.
Trading involves risk. All decisions remain the trader’s responsibility.
Chapter 10 — Exit Intelligence & Trade Aging (Next chapter coming soon)
Just tell me if you have any clarification.
#TradingEducation
#MarketStructure
#ExecutionDiscipline
#RiskManagement
#TradeManagement
#MarketObservation
#ExecutionIntelligence
#TradingPsychology
#InstitutionalTrading
#PriceAction
#Liquidity
#TrendAnalysis
#CapitalProtection
#Consistency
#TradingView

MARAL Execution Workflow, Long & Short Permission , Dynamic risk mapper & Deep Candle Intelligence
Context → Liquidity Event → Displacement → Structure Shift → POI Confirmation → Risk Clearance (Discretionary | Educational)
Context → Liquidity Event → Displacement → Structure Shift → POI Confirmation → Risk Clearance (Discretionary | Educational)
Haftungsausschluss
Die Informationen und Veröffentlichungen sind nicht als Finanz-, Anlage-, Handels- oder andere Arten von Ratschlägen oder Empfehlungen gedacht, die von TradingView bereitgestellt oder gebilligt werden, und stellen diese nicht dar. Lesen Sie mehr in den Nutzungsbedingungen.
MARAL Execution Workflow, Long & Short Permission , Dynamic risk mapper & Deep Candle Intelligence
Context → Liquidity Event → Displacement → Structure Shift → POI Confirmation → Risk Clearance (Discretionary | Educational)
Context → Liquidity Event → Displacement → Structure Shift → POI Confirmation → Risk Clearance (Discretionary | Educational)
Haftungsausschluss
Die Informationen und Veröffentlichungen sind nicht als Finanz-, Anlage-, Handels- oder andere Arten von Ratschlägen oder Empfehlungen gedacht, die von TradingView bereitgestellt oder gebilligt werden, und stellen diese nicht dar. Lesen Sie mehr in den Nutzungsbedingungen.