
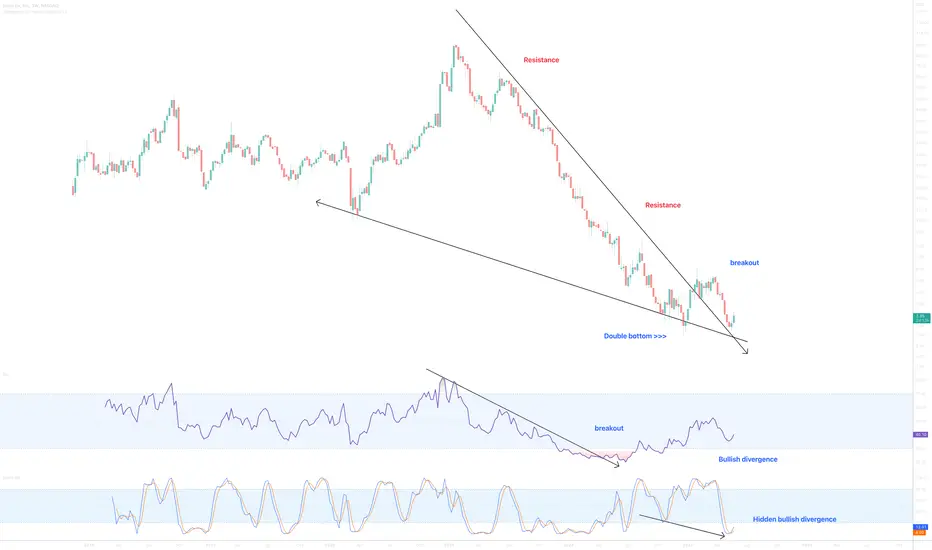
On the above weekly chart price action has corrected 97% since the sell signal printed in February 2021. A number of reasons now exist to have a long position, including:
1) You know why..
2) Price action and RSI resistance breakouts.
3) Price action prints a double with higher lows in RSI.
4) Stochastic RSI prints hidden bullish divergence, fantastic.
5) No stock splits.
Is it possible price action falls further? Sure.
Is it probable? No.
Ww
Type: investment
Risk: <=6% of portfolio
Timeframe: Don’t know.
Return: Will say somewhere else
Stop loss: <= 2.40
Trade ist aktiv
Support on past resistance now confirmed.Anmerkung
GRM support confirmedAnmerkung
breakout! Hold it until 100+ dollarsTrade ist aktiv
Anmerkung
resistance breakout Anmerkung
Past resistance confirms support.
Haftungsausschluss
Die Informationen und Veröffentlichungen sind nicht als Finanz-, Anlage-, Handels- oder andere Arten von Ratschlägen oder Empfehlungen gedacht, die von TradingView bereitgestellt oder gebilligt werden, und stellen diese nicht dar. Lesen Sie mehr in den Nutzungsbedingungen.
Haftungsausschluss
Die Informationen und Veröffentlichungen sind nicht als Finanz-, Anlage-, Handels- oder andere Arten von Ratschlägen oder Empfehlungen gedacht, die von TradingView bereitgestellt oder gebilligt werden, und stellen diese nicht dar. Lesen Sie mehr in den Nutzungsbedingungen.