SHOPIFY Bottom Potential
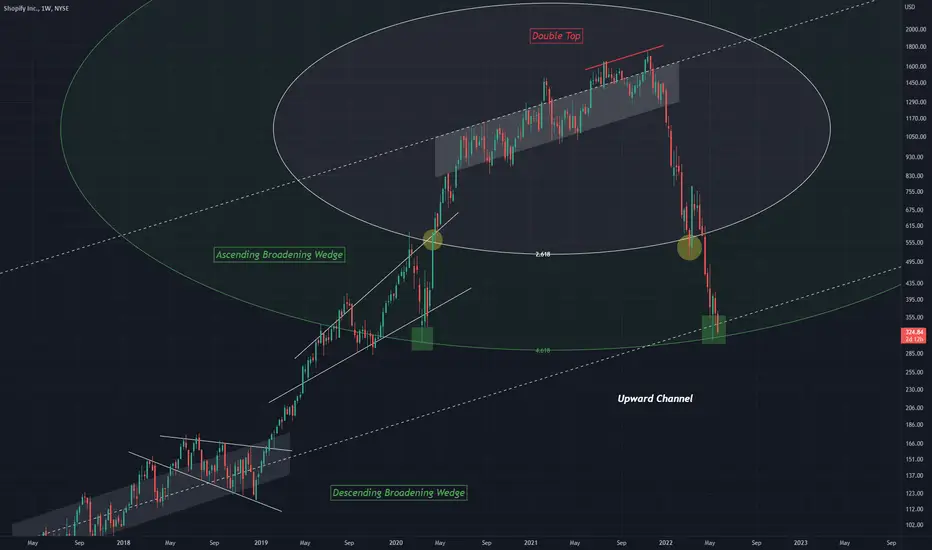
An upward channel can be drawn from a strong trend line point on SHOPIFY
It provides a chart like this, showing a clear top, and also a potential bottom that aligns with the 4.618 fib
An attempted support can be seen to have formed at 2.618 (yellow)
This leaves 4.618 as a bottom point, which has also been seen as a bottom in the past (green)
Two bullish chart patterns can be seen on chart along with one bearish
Ascending and Descending wedge both acting bullishly
Followed by a Double top, considered a bearish pattern
It provides a chart like this, showing a clear top, and also a potential bottom that aligns with the 4.618 fib
An attempted support can be seen to have formed at 2.618 (yellow)
This leaves 4.618 as a bottom point, which has also been seen as a bottom in the past (green)
Two bullish chart patterns can be seen on chart along with one bearish
Ascending and Descending wedge both acting bullishly
Followed by a Double top, considered a bearish pattern

Haftungsausschluss
Die Informationen und Veröffentlichungen sind nicht als Finanz-, Anlage-, Handels- oder andere Arten von Ratschlägen oder Empfehlungen gedacht, die von TradingView bereitgestellt oder gebilligt werden, und stellen diese nicht dar. Lesen Sie mehr in den Nutzungsbedingungen.
Haftungsausschluss
Die Informationen und Veröffentlichungen sind nicht als Finanz-, Anlage-, Handels- oder andere Arten von Ratschlägen oder Empfehlungen gedacht, die von TradingView bereitgestellt oder gebilligt werden, und stellen diese nicht dar. Lesen Sie mehr in den Nutzungsbedingungen.