
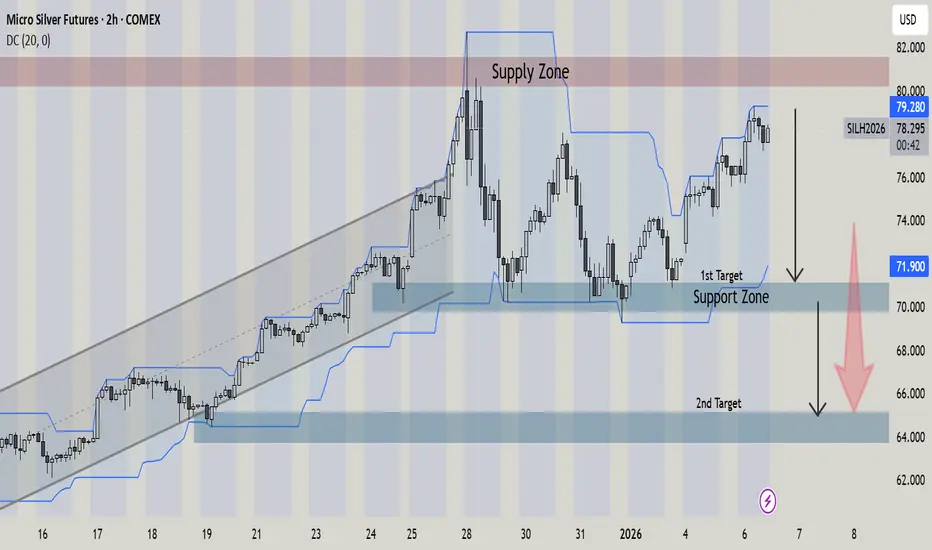
This is a 2-hour Micro Silver Futures (COMEX) chart** showing price action from mid-December into early January 2026.
Trend context:
Price previously moved higher within an upward channel, indicating a strong bullish phase. That trend later transitioned into range-bound and corrective price action.
Supply zone (upper red band ~79–80)
The chart highlights a clear **supply/resistance area** where price was previously rejected. Current price is again approaching this zone, suggesting selling pressure may re-emerge.
Support zone / 1st target (~71–72)
A well-defined **support zone is marked below current price. This area acted as a reaction base multiple times and is labeled as the **first downside target** if price pulls back.
Lower support / 2nd target (~64–65)
A broader and deeper **demand/support zone** is identified as a **second downside target**, representing a more significant correction level.
Indicator structure:
The blue stepped lines (likely a volatility or channel-based indicator) show price oscillating between upper and lower boundaries, reinforcing the idea of **mean reversion between supply and support**.
* **Overall bias illustrated:**
The chart visually suggests **upside is limited near supply**, with arrows indicating a **potential downward move** toward the first support zone, and possibly the second if momentum weakens further.
In summary, the chart presents a market **testing resistance after a strong advance**, with clearly mapped **support levels below** that may come into play if a pullback occurs.

telegram channel link
t.me/+4HnhYAZNJ-lhNmY0
join to get daily basis 2-3 free signal for educational purpose
t.me/+4HnhYAZNJ-lhNmY0
get information about Gold, BTC and forex market
t.me/+4HnhYAZNJ-lhNmY0
t.me/+4HnhYAZNJ-lhNmY0
join to get daily basis 2-3 free signal for educational purpose
t.me/+4HnhYAZNJ-lhNmY0
get information about Gold, BTC and forex market
t.me/+4HnhYAZNJ-lhNmY0
Verbundene Veröffentlichungen
Haftungsausschluss
Die Informationen und Veröffentlichungen sind nicht als Finanz-, Anlage-, Handels- oder andere Arten von Ratschlägen oder Empfehlungen gedacht, die von TradingView bereitgestellt oder gebilligt werden, und stellen diese nicht dar. Lesen Sie mehr in den Nutzungsbedingungen.