
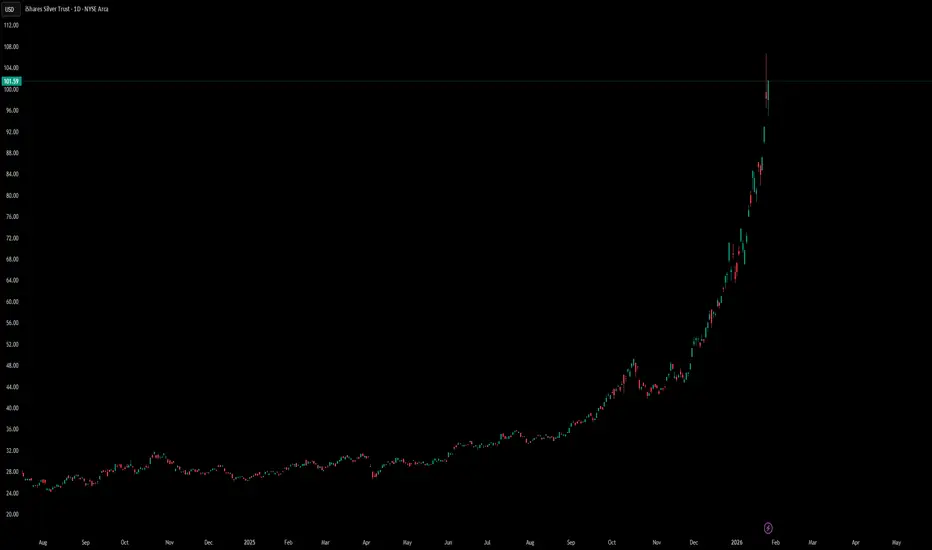
The SLV chart depicts a massive "blow-off top" or hyper-growth phase. The momentum is aggressively to the upside, but the distance from the nearest technical support (27.66) indicates the asset is significantly over-extended from its mean.
Bull Case: Momentum is dominant. With no overhead resistance, the price can theoretically run until buyer exhaustion occurs.
Bear/Risk Case: The vertical ascent leaves the asset vulnerable to sharp, volatile corrections, as there is little established market structure between 101 and 30 to catch a falling price.
Bull Case: Momentum is dominant. With no overhead resistance, the price can theoretically run until buyer exhaustion occurs.
Bear/Risk Case: The vertical ascent leaves the asset vulnerable to sharp, volatile corrections, as there is little established market structure between 101 and 30 to catch a falling price.

Haftungsausschluss
Die Informationen und Veröffentlichungen sind nicht als Finanz-, Anlage-, Handels- oder andere Arten von Ratschlägen oder Empfehlungen gedacht, die von TradingView bereitgestellt oder gebilligt werden, und stellen diese nicht dar. Lesen Sie mehr in den Nutzungsbedingungen.
Haftungsausschluss
Die Informationen und Veröffentlichungen sind nicht als Finanz-, Anlage-, Handels- oder andere Arten von Ratschlägen oder Empfehlungen gedacht, die von TradingView bereitgestellt oder gebilligt werden, und stellen diese nicht dar. Lesen Sie mehr in den Nutzungsbedingungen.