
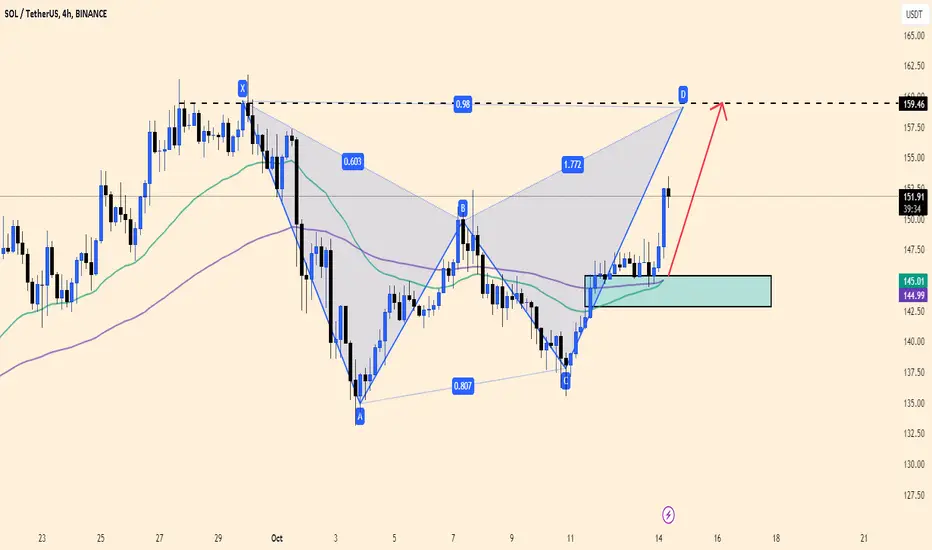
The chart for SOL/USDT presents a bullish harmonic pattern (likely a Gartley or Butterfly), with the price currently sitting around $152.22 after a recent upward move. The "D" point, which forms the completion of the harmonic pattern, suggests that the price could be setting up for a potential reversal or continuation to the upside, targeting the key resistance level at $159.46.
The green zone around $145.00 serves as a critical support level where buyers have previously stepped in. A breakout above the $159.46 resistance could signal a strong bullish continuation. However, if the price fails to break this level and reverses, it could retest the support zone. Traders should monitor this zone closely for any breakouts or reversals in the short term.
The green zone around $145.00 serves as a critical support level where buyers have previously stepped in. A breakout above the $159.46 resistance could signal a strong bullish continuation. However, if the price fails to break this level and reverses, it could retest the support zone. Traders should monitor this zone closely for any breakouts or reversals in the short term.
Trade ist aktiv
.
Verbundene Veröffentlichungen
Haftungsausschluss
Die Informationen und Veröffentlichungen sind nicht als Finanz-, Anlage-, Handels- oder andere Arten von Ratschlägen oder Empfehlungen gedacht, die von TradingView bereitgestellt oder gebilligt werden, und stellen diese nicht dar. Lesen Sie mehr in den Nutzungsbedingungen.
Verbundene Veröffentlichungen
Haftungsausschluss
Die Informationen und Veröffentlichungen sind nicht als Finanz-, Anlage-, Handels- oder andere Arten von Ratschlägen oder Empfehlungen gedacht, die von TradingView bereitgestellt oder gebilligt werden, und stellen diese nicht dar. Lesen Sie mehr in den Nutzungsbedingungen.