
Hello, traders.
If you follow me, you'll be able to receive new market updates and analysis as soon as they are posted.
Wishing you a successful trading day.
━━━━━━━━━━━━━━━━━━━━━━━━━━━━━━━━━━
■ SOL Key Support & Resistance Zone
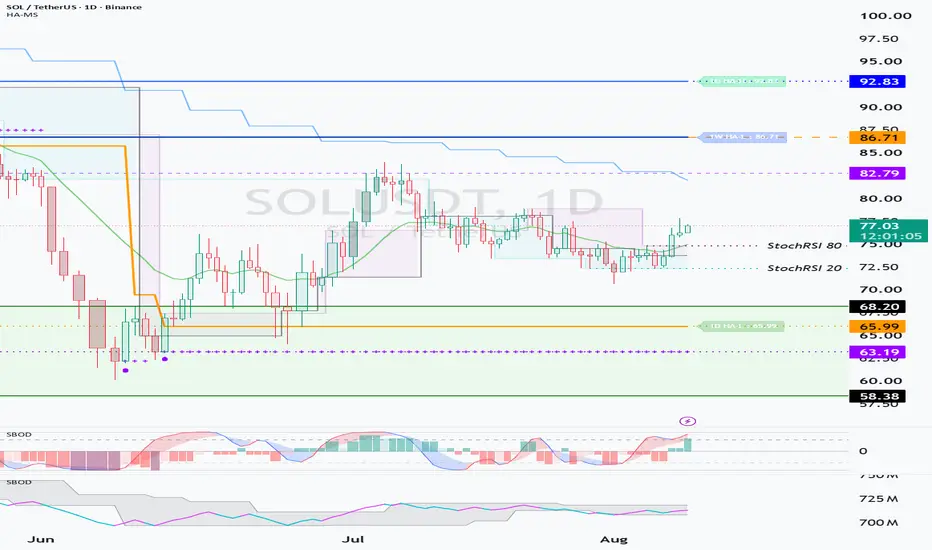
SOL is currently trading near one of its most important support and resistance zones:
▶ 58.38 ~ 68.20
If SOL establishes solid support around this area, the probability of a medium- to long-term trend reversal could increase significantly.
On the other hand, if price breaks below the 58.38 ~ 68.20 zone, SOL may enter a price range that should be approached from a longer-term investment perspective.
Therefore, it is important to prepare a capital management and risk management strategy in advance in case this zone fails to hold.
The HA-Low on the 1W chart is currently located around:
▶ 86.71
For SOL to develop a meaningful bullish structure, the key will be whether price can move above 86.71 and successfully turn this level into support.
━━━━━━━━━━━━━━━━━━━━━━━━━━━━━━━━━━
■ How Should We Use HA-Low and HA-High?
The major trading opportunities on this chart are determined by how price reacts around the HA-Low and HA-High levels.
In simple terms:
▶ HA-Low = Key zone for buying and accumulation
▶ HA-High = Key zone for profit-taking and managing positions near potential highs
[ HA-Low ]
The HA-Low area is one of the key zones for looking for buying opportunities.
However, a breakdown below HA-Low should not automatically be interpreted as a buy signal.
If HA-Low continues to move lower in a step-down pattern, it indicates that the market is still undergoing additional price correction.
At the same time, this process may eventually develop into an accumulation structure that sets the stage for a future bullish reversal.
Therefore, as HA-Low moves lower, rather than entering a large position all at once, it is more important to monitor whether price establishes support around each newly formed HA-Low and build the position gradually.
[ HA-High ]
HA-High has a completely different role.
Since HA-High represents a potential high-price zone, protecting profits should be the priority when price approaches this area.
Therefore, around HA-High, traders should consider:
▶ Partial profit-taking
▶ Raising stop levels
▶ Protecting unrealized profits
If price falls below HA-High and the level turns into resistance, reducing risk through a stop-loss or additional partial selling may be necessary.
On the other hand, if price breaks above HA-High and successfully converts it into support, a short-term day-trading opportunity may develop.
However, if price subsequently falls back below HA-High and the level becomes resistance again, strict stop-loss management is essential.
In other words:
▶ HA-Low breakdown = Look for accumulation structure and potential re-entry opportunities
▶ HA-High breakdown = Prioritize profit protection and risk management
Although both situations involve price moving lower, their implications are fundamentally different.
━━━━━━━━━━━━━━━━━━━━━━━━━━━━━━━━━━
■ A Strong Rally Ultimately Requires a Break Above HA-High
For price to transition into a strong bullish trend, it ultimately needs to break above HA-High and maintain price above that level.
To generate enough momentum for such a move, it is important that sufficient accumulation takes place around HA-Low.
However, individual traders have no reliable way of knowing the actual amount of accumulation taking place in the market.
Therefore, what we can do is gradually increase our holdings in potential accumulation zones while continuing to protect our trading capital.
This is where the following strategy becomes important:
▶ "Buy → Sell → Re-buy"
Instead of continuously buying without taking profits, the idea is to use market volatility to recover capital while gradually increasing the amount of coins you hold.
━━━━━━━━━━━━━━━━━━━━━━━━━━━━━━━━━━
■ Increasing Holdings While Recovering Capital
For example, after buying at a certain price, if the market moves higher, you can sell approximately 50% of the amount invested in that entry to recover part of your capital.
By repeating this process, you can maintain liquidity for future buying opportunities.
If available trading capital begins to run low, you can sell enough of a profitable position to recover the original capital allocated to that entry.
This allows you to recover your principal while keeping the remaining coins as profit.
The most conservative version of this strategy is:
▶ Recover 100% of the original capital after price rises
At first, this may appear to leave you with too few coins.
However, the final number of coins accumulated can vary significantly depending on how much market volatility you are able to trade and how many successful trading cycles you complete.
If volatility is low, the amount accumulated will naturally be smaller.
If volatility is high, effective short-term trading may provide more opportunities to increase your remaining holdings.
Therefore, during an accumulation phase, the objective should not simply be to "buy cheap."
The following four elements should be considered together:
▶ Protect trading capital
▶ Recover principal
▶ Maintain capital for re-entry
▶ Gradually increase coin holdings
━━━━━━━━━━━━━━━━━━━━━━━━━━━━━━━━━━
■ SOL's Current Short-Term Structure
SOL is currently maintaining bullish momentum after moving above the StochRSI 80 level.
However, the Stochastic RSI indicator itself is currently in the overbought zone.
This means that upside momentum may eventually face some resistance or temporary limitations.
Therefore, as Stochastic RSI resets from the overbought region, it will be important to monitor whether price can maintain support around the StochRSI 80 price level.
[ CASE 1. Support Holds Around the StochRSI 80 Level ]
If price continues to hold around the StochRSI 80 level while the indicator resets, the current bullish structure is more likely to remain intact.
In that case, the next key zone to watch is:
▶ 82.79 ~ 86.71
[ CASE 2. Support Fails Around the StochRSI 80 Level ]
If price fails to establish support, the correction could extend toward:
▶ 68.20
During such a decline, price action around the StochRSI 20 level should be monitored closely to determine whether partial selling is necessary.
━━━━━━━━━━━━━━━━━━━━━━━━━━━━━━━━━━
■ SOL's Key Upside Breakout Zone
If SOL continues higher, the first major area to watch is:
▶ 1W Key Zone: 82.79 ~ 86.71
The 1W HA-Low is currently located around 86.71.
Therefore, simply breaking above this zone is not enough.
The key is whether SOL can break above the 82.79 ~ 86.71 zone and successfully convert it into support.
Above this area, the 1D HA-High is currently located around:
▶ 92.83
Since HA-High represents a potential high-price zone, traders should prioritize protecting profits around 92.83 rather than simply expecting further upside.
Partial profit-taking should therefore be considered as price approaches this level.
This means SOL's major upside decision zone can currently be defined as:
▶ 82.79 ~ 92.83
If SOL breaks through this entire zone and successfully establishes support above it, selling pressure may be absorbed and bullish momentum could strengthen significantly.
Under those conditions, the probability of SOL developing a much stronger bullish trend would increase.
━━━━━━━━━━━━━━━━━━━━━━━━━━━━━━━━━━
■ Key Levels Summary
▶ Major Medium-/Long-Term Support & Resistance:
58.38 ~ 68.20
▶ 1W Key Zone:
82.79 ~ 86.71
▶ 1W HA-Low:
86.71
▶ 1D HA-High:
92.83
▶ Major Upside Decision Zone:
82.79 ~ 92.83
The most important factor for SOL right now is not simply whether price moves higher.
SOL needs to build enough momentum to move above 82.79 and successfully convert the 82.79 ~ 86.71 zone into support.
If price then approaches 92.83, protecting profits should come first while monitoring whether the 1D HA-High can be broken and converted into support.
Ultimately, the core principle remains simple:
"Look for opportunities to accumulate around HA-Low,
and protect profits around HA-High."
Maintaining this principle while taking advantage of market volatility is the key to managing both opportunity and risk.
━━━━━━━━━━━━━━━━━━━━━━━━━━━━━━━━━━
Thank you for reading.
Wishing you successful trading.

YouTube: youtube.com/@readcrypto9837
※ Follow X to check out the posts.
※ X를 팔로우하고 게시물을 확인하세요.
◆ t.me/readCryptoChannel
[HA-MS Indicator]
bit.ly/3YxHgvN
[OBV Indicator]
bit.ly/4dcyny3
※ Follow X to check out the posts.
※ X를 팔로우하고 게시물을 확인하세요.
◆ t.me/readCryptoChannel
[HA-MS Indicator]
bit.ly/3YxHgvN
[OBV Indicator]
bit.ly/4dcyny3
Verbundene Veröffentlichungen
Haftungsausschluss
Die Informationen und Veröffentlichungen sind nicht als Finanz-, Anlage-, Handels- oder andere Arten von Ratschlägen oder Empfehlungen gedacht, die von TradingView bereitgestellt oder gebilligt werden, und stellen diese nicht dar. Lesen Sie mehr in den Nutzungsbedingungen.
YouTube: youtube.com/@readcrypto9837
※ Follow X to check out the posts.
※ X를 팔로우하고 게시물을 확인하세요.
◆ t.me/readCryptoChannel
[HA-MS Indicator]
bit.ly/3YxHgvN
[OBV Indicator]
bit.ly/4dcyny3
※ Follow X to check out the posts.
※ X를 팔로우하고 게시물을 확인하세요.
◆ t.me/readCryptoChannel
[HA-MS Indicator]
bit.ly/3YxHgvN
[OBV Indicator]
bit.ly/4dcyny3
Verbundene Veröffentlichungen
Haftungsausschluss
Die Informationen und Veröffentlichungen sind nicht als Finanz-, Anlage-, Handels- oder andere Arten von Ratschlägen oder Empfehlungen gedacht, die von TradingView bereitgestellt oder gebilligt werden, und stellen diese nicht dar. Lesen Sie mehr in den Nutzungsbedingungen.