
📊 SPARC |
Monthly Chart Analysis
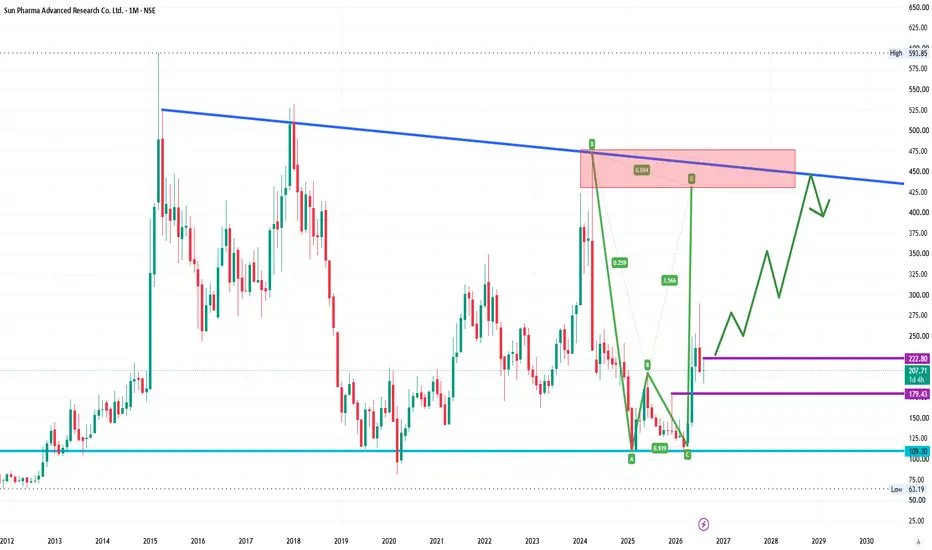
A Potential Bearish Harmonic X-A-B-C-D pattern is developing on the monthly chart.
🔥 Strong Resistance / PRZ: ₹430–₹475
📉 Major Trendline Resistance: ~₹450
🟢 Bullish Scenario
Above ₹225 on a strong monthly close:
🎯 ₹300 → ₹350 → ₹400+
🔴 Bearish Scenario
Rejection from ₹180–₹170 + breakdown:
🎯 ₹140 → ₹100
📌 Current Price: ~₹208
📌 Major Support: ₹100–₹110
📌 Key Decision Zone: ₹430–₹475
The ₹430–₹475 zone is the BIG level to watch.
⚠️ Pattern confirmation is required before taking any trade.
⚠️ Technical analysis only. Not a buy/sell recommendation.
#SPARC #HarmonicPattern #TechnicalAnalysis #NSE #StockMarket #SwingTrading #PriceAction
Monthly Chart Analysis
A Potential Bearish Harmonic X-A-B-C-D pattern is developing on the monthly chart.
🔥 Strong Resistance / PRZ: ₹430–₹475
📉 Major Trendline Resistance: ~₹450
🟢 Bullish Scenario
Above ₹225 on a strong monthly close:
🎯 ₹300 → ₹350 → ₹400+
🔴 Bearish Scenario
Rejection from ₹180–₹170 + breakdown:
🎯 ₹140 → ₹100
📌 Current Price: ~₹208
📌 Major Support: ₹100–₹110
📌 Key Decision Zone: ₹430–₹475
The ₹430–₹475 zone is the BIG level to watch.
⚠️ Pattern confirmation is required before taking any trade.
⚠️ Technical analysis only. Not a buy/sell recommendation.
#SPARC #HarmonicPattern #TechnicalAnalysis #NSE #StockMarket #SwingTrading #PriceAction

Haftungsausschluss
Die Informationen und Veröffentlichungen sind nicht als Finanz-, Anlage-, Handels- oder andere Arten von Ratschlägen oder Empfehlungen gedacht, die von TradingView bereitgestellt oder gebilligt werden, und stellen diese nicht dar. Lesen Sie mehr in den Nutzungsbedingungen.
Haftungsausschluss
Die Informationen und Veröffentlichungen sind nicht als Finanz-, Anlage-, Handels- oder andere Arten von Ratschlägen oder Empfehlungen gedacht, die von TradingView bereitgestellt oder gebilligt werden, und stellen diese nicht dar. Lesen Sie mehr in den Nutzungsbedingungen.