
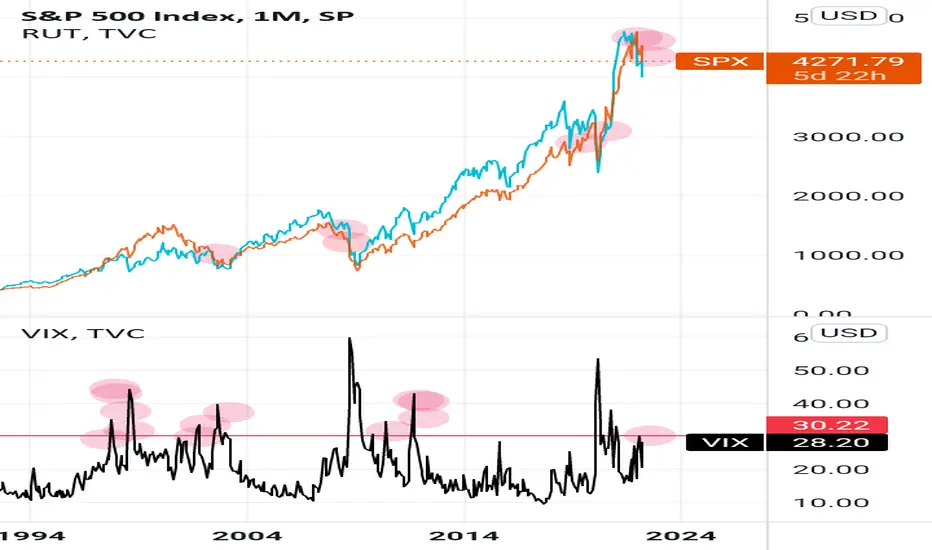
Chart 1: Whenever the the Russell 2000 came down and got close (from above) to the SPX, the SPX went further down.
(Pleased ignore the first red dot to the left, as the Russell die not come down there to meet the SPX but vice versa)
Chart 2: Whenever the VIX, coming from a modest down, crossed the red line, soon further spikes in volatility followed (red dots).
Particularly if the the VIX should cross the red line soon, you might consider hedging your positions.
Anmerkung
Please also note the VIX pattern since last May, which cannot be found at any other spot in the VIX!
Verbundene Veröffentlichungen
Haftungsausschluss
Die Informationen und Veröffentlichungen sind nicht als Finanz-, Anlage-, Handels- oder andere Arten von Ratschlägen oder Empfehlungen gedacht, die von TradingView bereitgestellt oder gebilligt werden, und stellen diese nicht dar. Lesen Sie mehr in den Nutzungsbedingungen.