
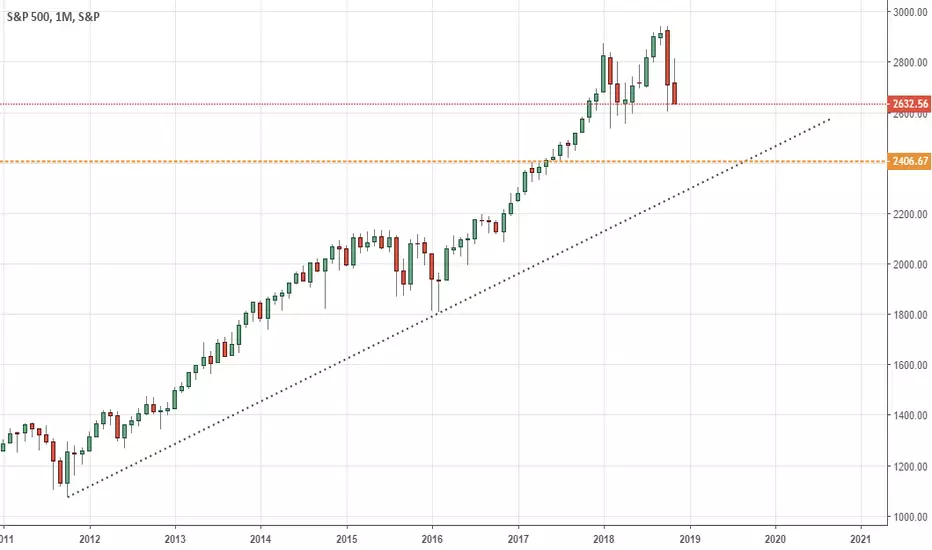
We are looking at a long-term chart that will tell us a lot of information that corresponds to the world economy.
Pay attention to the highlighted areas for a bounce or break!

We will keep an eye on the 2.400 AREA should the price break down further.
* the area with the most momentum is currently the short side because the US economy is fundamentally slowing down at the moment.
For more information:
drive.google.com/open?id=1zkulMZ22W4DY5r7hzHPgkADqMnlUnQ2d
Pay attention to the highlighted areas for a bounce or break!
We will keep an eye on the 2.400 AREA should the price break down further.
* the area with the most momentum is currently the short side because the US economy is fundamentally slowing down at the moment.
For more information:
drive.google.com/open?id=1zkulMZ22W4DY5r7hzHPgkADqMnlUnQ2d
Anmerkung
Coming for the retest

Haftungsausschluss
Die Informationen und Veröffentlichungen sind nicht als Finanz-, Anlage-, Handels- oder andere Arten von Ratschlägen oder Empfehlungen gedacht, die von TradingView bereitgestellt oder gebilligt werden, und stellen diese nicht dar. Lesen Sie mehr in den Nutzungsbedingungen.
Haftungsausschluss
Die Informationen und Veröffentlichungen sind nicht als Finanz-, Anlage-, Handels- oder andere Arten von Ratschlägen oder Empfehlungen gedacht, die von TradingView bereitgestellt oder gebilligt werden, und stellen diese nicht dar. Lesen Sie mehr in den Nutzungsbedingungen.