
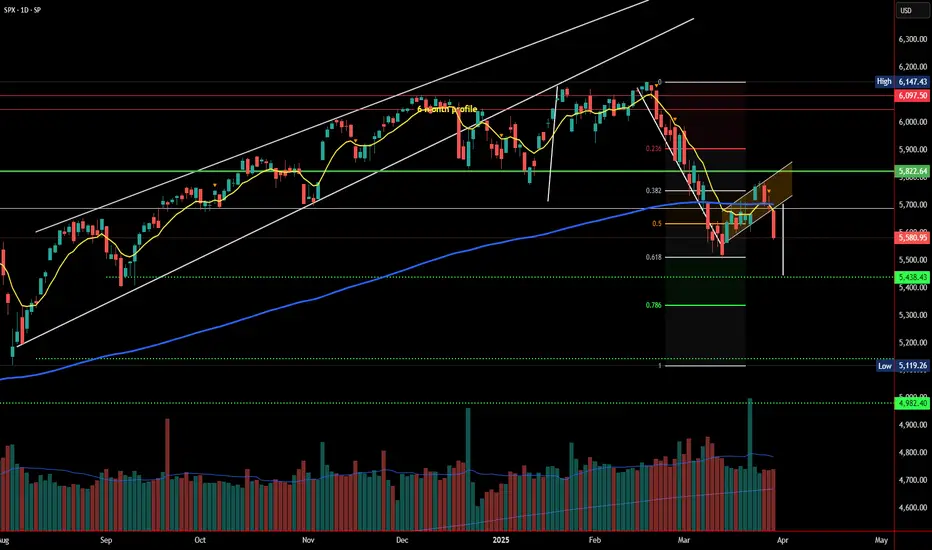
Looking at this SPX Daily Chart, we’re seeing some clear signs of weakness in the market.
🔹 Breakdown from the Rising Channel – After months of uptrend, SPX has broken below its previous rising channel, signaling potential downside ahead.
🔹 Failed Recovery Attempt – The recent bounce formed a bear flag (highlighted in brown), but today’s sharp drop indicates that the relief rally has been rejected.
🔹 Key Fibonacci Levels in Play –
🔹 Moving Averages & Volume –
🔹 Support & Resistance Zones –
🚨 Final Thoughts: The technical structure is turning bearish, and if the S&P 500 doesn’t reclaim key levels soon, further downside could be on the horizon. Bulls need to step in fast to avoid a deeper correction.
🔹 Breakdown from the Rising Channel – After months of uptrend, SPX has broken below its previous rising channel, signaling potential downside ahead.
🔹 Failed Recovery Attempt – The recent bounce formed a bear flag (highlighted in brown), but today’s sharp drop indicates that the relief rally has been rejected.
🔹 Key Fibonacci Levels in Play –
- The 0.382 Fib retracement was acting as support, but price has now slipped below it.
- Next key level: The 0.5 Fib (around 5,550) and the 0.618 Fib (near 5,438) could act as crucial support zones.
- A deeper retracement to 4,982 (0.786 Fib) isn't out of the question if selling pressure accelerates.
🔹 Moving Averages & Volume –
- The price is now under the 200-day moving average (blue line), which is typically a bearish signal if confirmed.
- Volume has been increasing on red days, hinting at stronger selling conviction.
🔹 Support & Resistance Zones –
- Resistance: ~5,822 (recent bounce level) and ~6,097 (previous high)
- Support: ~5,402 and ~4,982 if selling intensifies.
🚨 Final Thoughts: The technical structure is turning bearish, and if the S&P 500 doesn’t reclaim key levels soon, further downside could be on the horizon. Bulls need to step in fast to avoid a deeper correction.

Haftungsausschluss
Die Informationen und Veröffentlichungen sind nicht als Finanz-, Anlage-, Handels- oder andere Arten von Ratschlägen oder Empfehlungen gedacht, die von TradingView bereitgestellt oder gebilligt werden, und stellen diese nicht dar. Lesen Sie mehr in den Nutzungsbedingungen.
Haftungsausschluss
Die Informationen und Veröffentlichungen sind nicht als Finanz-, Anlage-, Handels- oder andere Arten von Ratschlägen oder Empfehlungen gedacht, die von TradingView bereitgestellt oder gebilligt werden, und stellen diese nicht dar. Lesen Sie mehr in den Nutzungsbedingungen.