S&P 500 Index ( SPX) 1H: Range Compression Locked Between 7,425 Support Floor and 7,570 Resistance Wall
### 🇺🇸 S&P 500 Index (SPX) 1-Hour Technical Matrix (Ref: SPX_2026-07-23_08-39-38.png)
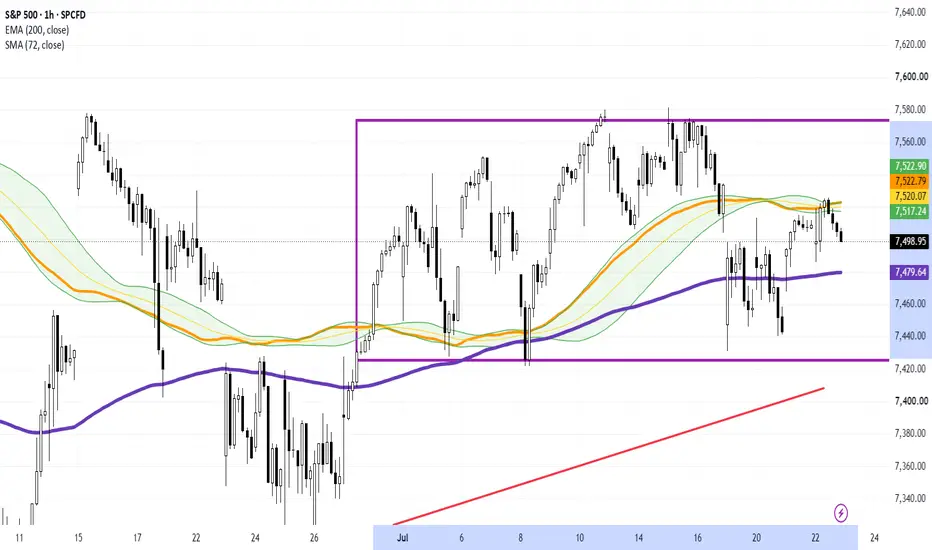
We are releasing an intraday structural framework on the S&P 500 Index (SPX) on the 1-Hour (1H) time horizon. Following the recent expansion leg, price action has transitioned into a well-defined horizontal trading range (highlighted purple consolidation corridor), balancing between clear institutional supply and demand boundaries.
The index is trading flat in early activity at **7,498.95 (-0.08%)**, hovering near the midpoint of the range.
---
### 🔍 Technical Architecture & Range Mechanics:
Our quantitative framework maps out a systematic range-bound setup on the hourly chart:
1. **The Overhead Supply Ceiling (Resistance):** Sellers have aggressively defended the upper boundary of the consolidation channel near **7,570.00 – 7,575.00**, forming a distinct local double-top rejection zone.
2. **The Demand Support Floor:** Buy-side liquidity remains heavily clustered at the bottom of the structure in the **7,425.00 – 7,430.00** zone. Multiple long lower shadows highlight active absorption at this floor.
3. **Dynamic Equilibrium (Point of Control):** Price is currently compressing right around the institutional **200-period EMA (purple line at 7,479.64)** and slightly beneath the **72-period SMA ribbon complex (7,517.24 – 7,522.90)**, signifying a classic temporary balance of power.
4. **Macro Safety Baseline:** Below the consolidation floor, an ascending baseline (red diagonal LTA) provides secondary structural support near the 7,400 corridor.
---
### 🔄 Tactical Execution Framework:
Within a mature trading range, directional momentum requires a clear breakout above or below boundary levels:
* **Bullish Breakout Trigger:** A sustained 1H candle close above **7,522.90** (72-SMA ribbon) clears the path for a retest of the range ceiling at **7,570.00**. A full breakout above 7,570 unlocks major open-air expansion.
* **Bearish Range Retest:** A drop below the **7,479.64** 200-EMA level will send price back down toward the key demand accumulation floor at **7,425.00**.
### 📊 Tactical Parameters Summary:
* **Market Condition:** Horizontal Range / Compression
* **Range Resistance (Ceiling):** 7,570.00
* **Dynamic Midpoint Anchor:** 7,479.64 (200-EMA)
* **Range Support (Floor):** 7,425.00
* **Macro Baseline Floor:** Red Diagonal LTA (~7,400.00)
---
📊 **ChartPro Data**
*US Equity Architecture, Range Mechanics & Intraday Risk Management.*
⚠️ **Disclaimer:** For educational and informational purposes only. This active market study represents a personal trading framework and does not constitute financial or investment advice.
SPX) 1H: Range Compression Locked Between 7,425 Support Floor and 7,570 Resistance Wall### 🇺🇸 S&P 500 Index (
SPX) 1-Hour Technical Matrix (Ref: SPX_2026-07-23_08-39-38.png)We are releasing an intraday structural framework on the S&P 500 Index (
SPX) on the 1-Hour (1H) time horizon. Following the recent expansion leg, price action has transitioned into a well-defined horizontal trading range (highlighted purple consolidation corridor), balancing between clear institutional supply and demand boundaries.The index is trading flat in early activity at **7,498.95 (-0.08%)**, hovering near the midpoint of the range.
---
### 🔍 Technical Architecture & Range Mechanics:
Our quantitative framework maps out a systematic range-bound setup on the hourly chart:
1. **The Overhead Supply Ceiling (Resistance):** Sellers have aggressively defended the upper boundary of the consolidation channel near **7,570.00 – 7,575.00**, forming a distinct local double-top rejection zone.
2. **The Demand Support Floor:** Buy-side liquidity remains heavily clustered at the bottom of the structure in the **7,425.00 – 7,430.00** zone. Multiple long lower shadows highlight active absorption at this floor.
3. **Dynamic Equilibrium (Point of Control):** Price is currently compressing right around the institutional **200-period EMA (purple line at 7,479.64)** and slightly beneath the **72-period SMA ribbon complex (7,517.24 – 7,522.90)**, signifying a classic temporary balance of power.
4. **Macro Safety Baseline:** Below the consolidation floor, an ascending baseline (red diagonal LTA) provides secondary structural support near the 7,400 corridor.
---
### 🔄 Tactical Execution Framework:
Within a mature trading range, directional momentum requires a clear breakout above or below boundary levels:
* **Bullish Breakout Trigger:** A sustained 1H candle close above **7,522.90** (72-SMA ribbon) clears the path for a retest of the range ceiling at **7,570.00**. A full breakout above 7,570 unlocks major open-air expansion.
* **Bearish Range Retest:** A drop below the **7,479.64** 200-EMA level will send price back down toward the key demand accumulation floor at **7,425.00**.
### 📊 Tactical Parameters Summary:
* **Market Condition:** Horizontal Range / Compression
* **Range Resistance (Ceiling):** 7,570.00
* **Dynamic Midpoint Anchor:** 7,479.64 (200-EMA)
* **Range Support (Floor):** 7,425.00
* **Macro Baseline Floor:** Red Diagonal LTA (~7,400.00)
---
📊 **ChartPro Data**
*US Equity Architecture, Range Mechanics & Intraday Risk Management.*
⚠️ **Disclaimer:** For educational and informational purposes only. This active market study represents a personal trading framework and does not constitute financial or investment advice.

Haftungsausschluss
Die Informationen und Veröffentlichungen sind nicht als Finanz-, Anlage-, Handels- oder andere Arten von Ratschlägen oder Empfehlungen gedacht, die von TradingView bereitgestellt oder gebilligt werden, und stellen diese nicht dar. Lesen Sie mehr in den Nutzungsbedingungen.
Haftungsausschluss
Die Informationen und Veröffentlichungen sind nicht als Finanz-, Anlage-, Handels- oder andere Arten von Ratschlägen oder Empfehlungen gedacht, die von TradingView bereitgestellt oder gebilligt werden, und stellen diese nicht dar. Lesen Sie mehr in den Nutzungsbedingungen.